Regionalisation with Spatially Constrained Cluster Analysis

Published

December 5, 2022

case study : Regionalisation by Multivariate Water Point Attributes with Non-spatially Constrained and Spatially Constrained Clustering Methods.

1. OVERVIEW

Regionalisation with Spatially Constrained clustering analysis requires similar observations to be grouped according to their statistical attributes and spatial location.

1.1 Objectives

  • Total number of water points by status, i.e. functional, non-functional, and unknown;

  • Percentage of water points by :

    • status (functional, non-functional, and unknown);

    • deployed water technology (hand pump, mechanical pump, stand tap, etc.) ;

    • usage capacity (1000, 300, 250, 50);

    • rural or urban.

1.2 Study Area Introduction

Alpha-3 Code : NGA

Population : 225 million (1st in Africa, 6th globally)

Local Government Areas (LGA) : 774

Water Point Observations : 95,008

Environmental Aspects :

  • Geography :

    • Southwest - “rugged” highland.

    • Southeast - hills and mountains, which form the Mambilla Plateau, the highest plateau in Nigeria.

  • Hydrology :

    • Two (2) main catchment areas - Chad Basin & Niger catchment area.

    • Surface area of lake Chad is shrinking recent decades due to irrigation activities.1

    • Untreated wastes dump in places resulted in waterways and groundwater pollution.2

  • Vegetation Coverage :

    • Lost nearly 80% of primary forest by 2012.3

    • States with dense forests concentrated : Bayelsa, Cross River, Edo, Ekiti, Ondo, Osun, Rivers, and Taraba.

  • 1 Wikipedia. Nigeria. https://en.wikipedia.org/wiki/Nigeria

  • 2 Ogbonna, D.N., Ekweozor, I.K.E., Igwe, F.U. (2002). “Waste Management: A Tool for Environmental Protection in Nigeria”. Ambio: A Journal of the Human Environment. 31 (1): 55–57. doi:10.1639/0044-7447(2002)031[0055:wmatfe]2.0.co;2.

  • 3 https://rainforests.mongabay.com/20nigeria.htm

  • 1.3 Scope of Works

    • import the shapefile into R with the appropriate sf method, and save it in a simple feature data frame format;
    Note

    Three (3) Projected Coordinate Systems of Nigeria, EPSG : 26391, 26392, and 26303.

    • derive the proportion of functional and non-functional water points at LGA level (i.e. ADM2) by appropriate tidyr and dplyr methods;

    • combine geospatial and aspatial data frames into a simple feature data frame.

    • delineate water points measures functional regions by using :

      • conventional hierarchical clustering.

      • spatially constrained clustering algorithms.

    • plot two (2) main types of maps below :

      Thematic Mapping

      Show the derived water-point measures by appropriate statistical graphics and choropleth mapping technique.

      Analytical Mapping

      Plot delineated functional regions using non-spatially constrained and spatially constrained clustering algorithms.

    2. R PACKAGE REQUIRED

    The following are the packages required for this exercise :

    !!!!! Tidy up the functions according to the high-level function category.

    2.1 Load R Packages

    Usage of the code chunk below :

    p_load( ) - pacman - to load packages into R environment. This function will attempt to install the package from CRAN or pacman repository list if it is not installed.

    Show the code
    pacman::p_load(sf, tidyverse, questionr, janitor, psych, ggplot2, gcookbook, tmap, ggpubr, egg, corrplot, gtsummary, regclass, caret, heatmaply, ggdendro, cluster, factoextra, spdep, ClustGeo, GGally, skimr, stringr, funModeling, knitr, caTools, viridis, rgeoda, cowplot, patchwork)

    3. GEOSPATIAL DATA

    3.1 Acquire Data

    Note

    The file size of the downloaded data is about 422 MB due to water points data from multiple countries.

    • Such file size may require extra effort and time to manage the code chunks and files in the R environment before pushing them to GitHub.

    Hence, to avoid any error in pushing files larger than 100 MB to Git, filtered Nigeria water points and removed unnecessary variables before uploading into the R environment.

    Therewith, the CSV file size should be lesser than 100 MB.

  • 4 Runfola, D. et al. (2020) geoBoundaries: A global database of political administrative boundaries. PLoS ONE 15(4): e0231866. https://doi.org/10.1371/journal.pone.0231866

  • 3.2 Import Attribute Data

    3.2.1 Import Aspatial Data

    read_csv( ) - readr - to import and save the comma separated value (CSV) file as a data frame, with title “wp_coord”.

    • col_select( ) - readr - to include only the selected variables into wp_cood data frame.

    rename( ) - dplyr - to remove “#” from the variables.

    problems( ) - readr - to reveal any parsing errors when importing the CSV file.

    Show the code
    wp_attribute <- read_csv("data/aspatial/WPdx_NGAv1.2.1.csv",
                           col_select = c(`row_id`,
                                          `#lat_deg`,
                                          `#lon_deg`,
                                          `New Georeferenced Column`,
                                          `lat_lon_deg`,
                                          `#water_source`,
                                          `#water_source_clean`,
                                          `#water_source_category`,
                                          `#water_tech_clean`,
                                          `#water_tech_category`,
                                          `#status_clean`,
                                          `#status`,
                                          `#status_id`,
                                          `#clean_adm1`,
                                          `#clean_adm2`,
                                          `water_point_population`,
                                          `local_population_1km`,
                                          `crucialness_score`,
                                          `pressure_score`,
                                          `usage_capacity`,
                                          `staleness_score`,
                                          `rehab_priority`,
                                          `is_urban`)) %>%
      rename(lat_deg = `#lat_deg`, 
             lon_deg = `#lon_deg`,
             water_source = `#water_source`,
             water_source_clean = `#water_source_clean`, 
             water_source_category = `#water_source_category`, 
             water_tech_clean = `#water_tech_clean`, 
             water_tech_category = `#water_tech_category`,
             status_clean = `#status_clean`,
             status = `#status`,
             status_id = `#status_id`,
             clean_adm1 = `#clean_adm1`,
             clean_adm2 = `#clean_adm2`)
    Rows: 95008 Columns: 23
    ── Column specification ────────────────────────────────────────────────────────
    Delimiter: ","
    chr (12): #status_id, #water_source_clean, #water_source_category, #water_te...
    dbl (10): row_id, #lat_deg, #lon_deg, rehab_priority, water_point_population...
    lgl  (1): is_urban
    
    ℹ Use `spec()` to retrieve the full column specification for this data.
    ℹ Specify the column types or set `show_col_types = FALSE` to quiet this message.
    Show the code
    problems(wp_attribute)

    3.2.2 Get Imported Data Frame Overview

    skim( ) - skimr - to get a broad overview of wp_coord data frame.

    skim(wp_attribute)

    3.2.3 Save Imported Data Frame into RDS Format

    write_rds( ) - readr - to save wp_attribute data table into an RDS format.

    note : reduce the file size with this function -> compress = “xz”.

    write_rds(wp_attribute,
              "data/geodata/wp_attribute.rds",
              compress = "xz")

    3.2.4 Read RDS File

    read_rds( ) - readr - to read wp_attribute RDS file into wp_attribute.

    wp_attribute <- read_rds("data/geodata/wp_attribute.rds")

    3.2.5 Convert Well Known Text (WKT) Data to SF Data Frame

    The “New Georeferenced Column” in wp_attribute contains spatial data in a WKT format.

    Two (2) steps to convert the WKT data format into an sf data frame :

    • derive “geometry” variable.

    • conversion to sf data frame.

    3.2.5.1 derive new field :: “geometry”

    st_as_sfc( ) - sf - to convert foreign geometry object `New Georeferenced Column` to an sfc object

    wp_attribute$geometry = st_as_sfc(wp_attribute$`New Georeferenced Column`)

    3.2.5.2 convert to SF Data Frame

    st_sf( ) - sf - to convert the tibble data frame into sf data frame with crs first set to WGS 84 (EPSG : 4326).

    st_crs( ) - sf - to retrieve coordinate reference system from the object.

    wp.sf<- st_sf(wp_attribute, crs = 4326)
    st_crs(wp.sf)
    Coordinate Reference System:
      User input: EPSG:4326 
      wkt:
    GEOGCRS["WGS 84",
        ENSEMBLE["World Geodetic System 1984 ensemble",
            MEMBER["World Geodetic System 1984 (Transit)"],
            MEMBER["World Geodetic System 1984 (G730)"],
            MEMBER["World Geodetic System 1984 (G873)"],
            MEMBER["World Geodetic System 1984 (G1150)"],
            MEMBER["World Geodetic System 1984 (G1674)"],
            MEMBER["World Geodetic System 1984 (G1762)"],
            MEMBER["World Geodetic System 1984 (G2139)"],
            ELLIPSOID["WGS 84",6378137,298.257223563,
                LENGTHUNIT["metre",1]],
            ENSEMBLEACCURACY[2.0]],
        PRIMEM["Greenwich",0,
            ANGLEUNIT["degree",0.0174532925199433]],
        CS[ellipsoidal,2],
            AXIS["geodetic latitude (Lat)",north,
                ORDER[1],
                ANGLEUNIT["degree",0.0174532925199433]],
            AXIS["geodetic longitude (Lon)",east,
                ORDER[2],
                ANGLEUNIT["degree",0.0174532925199433]],
        USAGE[
            SCOPE["Horizontal component of 3D system."],
            AREA["World."],
            BBOX[-90,-180,90,180]],
        ID["EPSG",4326]]


    3.3 Import Boundary Data

    3.3.1 Import Geospatial Data

    st_read( ) - sf - to read simple features.

    select( ) - dplyr - to select “shapeName” variable.

    bdy_nga.sf <- st_read(dsn = "data/geospatial",
                   layer = "geoBoundaries-NGA-ADM2",
                   crs = 4326) %>%
      select(shapeName)
    Reading layer `geoBoundaries-NGA-ADM2' from data source 
      `D:\jephOstan\ISSS624\class_project\project_2\data\geospatial' 
      using driver `ESRI Shapefile'
    Simple feature collection with 774 features and 5 fields
    Geometry type: MULTIPOLYGON
    Dimension:     XY
    Bounding box:  xmin: 2.668534 ymin: 4.273007 xmax: 14.67882 ymax: 13.89442
    Geodetic CRS:  WGS 84
    problems(bdy_nga.sf)

    3.3.3 Review Imported File

    3.3.3.1 check for missing and duplicated data

    Show the code
    skim(bdy_nga.sf)

    Remarks :

    • There is no missing data.

    • There are 774 unique “geometry” but only 768 unique “shapeName”

      • That means there are 6 values of “shapeName” duplicated among the identified unique “shapeName”.

    3.3.3.2 list the unique “shapeName” associated with duplication

    add_count( ) - dplyr - to count observations by group

    filter( ) - dplyr - to retain shapeName that has count not equal to 1.

    dupl_shapeName.sf <- bdy_nga.sf %>%
      add_count(bdy_nga.sf$shapeName) %>%
      filter(n != 1) %>%
      select(-n)
    
    freq(dupl_shapeName.sf$shapeName)
    Warning: The `<scale>` argument of `guides()` cannot be `FALSE`. Use "none" instead as
    of ggplot2 3.3.4.
    ℹ The deprecated feature was likely used in the funModeling package.
      Please report the issue at <https://github.com/pablo14/funModeling/issues>.

           var frequency percentage cumulative_perc
    1    Bassa         2      16.67           16.67
    2 Ifelodun         2      16.67           33.34
    3 Irepodun         2      16.67           50.01
    4 Nasarawa         2      16.67           66.68
    5      Obi         2      16.67           83.35
    6 Surulere         2      16.67          100.00

    3.3.3.3 verify findings in section 3.3.3.2

    tmap_mode( ) - tmap - to set tmap mode to static plotting or interactive.

    tm_shape( ) - tmap - to specify the shape object.

    tm_polygons( ) - tmap - to fill the polygons and draw the polygon borders.

    tm_view( ) - tmap - to set the options for the interactive tmap viewer.

    tm_fill( ) - tmap - to specify either which colour to be used or which data variable mapped to the colour palette.

    tm_borders( ) - tmap - to draw the polygon borders.

    tmap_style( ) - tmap - to set the tmap style.

    tm_layout( ) - tmap - to set the layout of cartographic map.

    tmap_mode("view")
    tmap mode set to interactive viewing
    tm_shape(bdy_nga.sf) +
      tm_polygons() +
      tm_view(set.zoom.limits = c(6,8)) +
      tm_shape(dupl_shapeName.sf) +
      tm_fill("shapeName",
              n = 6,
              style = "jenks") +
      tm_borders(alpha = 0.5) +
      tmap_style("albatross") +
      tm_layout(main.title = "Distribution of Duplicated ShapeName",
                main.title.size = 1.3,
                main.title.position = "center")
    tmap style set to "albatross"
    other available styles are: "white", "gray", "natural", "cobalt", "col_blind", "beaver", "bw", "classic", "watercolor" 
    Show the code
    tmap_mode("plot")
    tmap mode set to plotting

    Remarks :

    The plot above indicates those duplicated water points are not within the same location.

    3.3.3.4 acquire State info for duplicated value

    To identify the correct State for the duplicated “shapeName” value -

    • First, retrieve the centroid coordinate for each “shapeName”.

    • Next, get the coordinates for LGA Headquarters or Secretariat office via Google Maps.

    • Lastly, match the duplicated LGA’s coordinate with the offices’ coordinates to determine the State therein.

      • The steps to update can be referred to in section 3.4.1.
    centroid_dupl.sf <- dupl_shapeName.sf %>%
      mutate(st_centroid
             (dupl_shapeName.sf$geometry,
               of_largest_polygon = FALSE))
    
    centroid_dupl.sf[[4]]
    Geometry set for 12 features 
    Geometry type: POINT
    Dimension:     XY
    Bounding box:  xmin: 3.346919 ymin: 6.493217 xmax: 8.782946 ymax: 12.00446
    Geodetic CRS:  WGS 84
    First 5 geometries:
    POINT (7.031827 7.791971)
    POINT (8.782946 10.08015)
    POINT (5.052235 8.544311)
    POINT (4.636735 7.920948)
    POINT (4.926215 8.169349)
    lga row_id headquarter state iso3166code dupl_shapeName_coord lga_office_coord
    Bassa 94 Oguma Kogi NG.KO.BA 7.791971, 7.031827 7.80932, 6.74853
    Bassa 95 Bassa Plateau NG.PL.BA 10.08015, 8.782946 10.11143, 8.71559
    Ifelodun 304 Share Kwara NG.KW.IF 8.544311, 5.052235 8.5 5.0
    Ifelodun 305 Ikirun Osun NG.OS.ID 7.920948, 4.636735 7.5 4.5
    Irepodun 355 Omu Aran Kwara NG.KW.IR 8.169349, 4.926215 8.5 5.0
    Irepodun 356 Ilobu Osun NG.OS.IP 7.84861, 4.498797 7.5 4.5
    Nasarawa 519 Bompai Kano NG.KN.NA 12.00446, 8.578262 11.5, 8.5
    Nasarawa 520 Nasarawa Nasarawa NG.NA.NA 8.304034, 7.760272 8.53477, 7.70153
    Obi 546 Obarike-Ito Benue NG.BE.OB 7.022495, 8.281026 7.01129, 8.33118
    Obi 547 Obi Nasarawa NG.NA.OB 8.35534, 8.734777 8.37944, 8.78561
    Surelere 693 Surelere Lagos NG.LA.SU 6.493217, 3.346919 6.50048, 3.35488
    Surelere 694 Iresa-Adu Oyo NG.OY.SU 8.088897, 4.393574 8.08459, 4.38538

    :::

    3.4 Data Wrangling

    3.4.1 Edit Duplicated Value :: “shapeName”

    Update the LGA boundary data frame with the matched state and “shapeName” by row index.5

  • 5 Ong Z.R.J. (2022). Geospatial Analytics for Social Good - Understanding Nigeria Water functional and non-functional water point rate. https://jordan-isss624-geospatial.netlify.app/posts/geo/geospatial_exercise/#checking-of-duplicated-area-name

  • Show the code
    bdy_nga.sf$shapeName[c(94,95,304,305,355,356,519,520,546,547,693,694)] <- 
      c("Bassa Kogi",
        "Bassa Plateau",
        "Ifelodun Kwara",
        "Ifelodun Osun",
        "Irepodun Kwara",
        "Irepodun Osun",
        "Nasarawa Kano",
        "Nasarawa Nasarawa",
        "Obi Nasarawa",
        "Obi Benue",
        "Surulere Lagos",
        "Surulere Oyo")
    
    bdy_nga.sf$shapeName[c(94,95,304,305,355,356,519,520,546,547,693,694)]
     [1] "Bassa Kogi"        "Bassa Plateau"     "Ifelodun Kwara"   
     [4] "Ifelodun Osun"     "Irepodun Kwara"    "Irepodun Osun"    
     [7] "Nasarawa Kano"     "Nasarawa Nasarawa" "Obi Nasarawa"     
    [10] "Obi Benue"         "Surulere Lagos"    "Surulere Oyo"     

    3.4.1.1 validate edited value :: “shapeName”

    Show the code
    dupl_shapeName_val.sf <- bdy_nga.sf %>%
      add_count(bdy_nga.sf$shapeName) %>%
      filter(n != 1) %>%
      select(-n)
    
    dupl_shapeName_val.sf
    Simple feature collection with 0 features and 2 fields
    Bounding box:  xmin: NA ymin: NA xmax: NA ymax: NA
    Geodetic CRS:  WGS 84
    [1] shapeName            bdy_nga.sf$shapeName geometry            
    <0 rows> (or 0-length row.names)

    3.4.2 Perform Point-in-Polygon Overlay

    Combine the attribute and boundary of the water points into a simple feature object.

    3.4.2.1 join objects :: wp.sf, bdy_nga.sf

    st_join( ) - sf - to join sf-class objects based on geometry, namely, wp.sf and bdy_nga.sf.

    Show the code
    wp_joined.sf <- st_join(x = wp.sf,
                            y = bdy_nga.sf,
                            join = st_intersects,
                            left = TRUE)

    3.4.2.2 inspect joined file :: wp_joined

    -- assess the uniqueness of water Point

    wp_joined.sf %>% janitor::get_dupes(shapeName,lat_lon_deg)
    No duplicate combinations found of: shapeName, lat_lon_deg
    Simple feature collection with 0 features and 25 fields
    Bounding box:  xmin: NA ymin: NA xmax: NA ymax: NA
    Geodetic CRS:  WGS 84
    # A tibble: 0 × 26
    # … with 26 variables: shapeName <chr>, lat_lon_deg <chr>, dupe_count <int>,
    #   row_id <dbl>, lat_deg <dbl>, lon_deg <dbl>, New Georeferenced Column <chr>,
    #   water_source <chr>, water_source_clean <chr>, water_source_category <chr>,
    #   water_tech_clean <chr>, water_tech_category <chr>, status_clean <chr>,
    #   status <chr>, status_id <chr>, clean_adm1 <chr>, clean_adm2 <chr>,
    #   water_point_population <dbl>, local_population_1km <dbl>,
    #   crucialness_score <dbl>, pressure_score <dbl>, usage_capacity <dbl>, …

    Remarks :

    Each water point observation is unique as there is no duplication between the “shapeName” and “lat_lon_deg”.

    -- determine reference point :: “shapeName” / “clean_adm2”

    wp_reference <- (wp_joined.sf$shapeName == wp_joined.sf$clean_adm2)
    
    summary(wp_reference)
       Mode   FALSE    TRUE    NA's 
    logical   29856   65123      29 

    Remarks :

    • There are 29,856 “FALSE”, which is approximately 31% of LGA names mismatched between “shapeName” and “clean_adm2”.

      • Since the geoBoundaries data is collected from government-published and reliable internet sources.6

        • Hence, the “shapeName” variable will be used throughout this study.
    • The 29 NA’s are 29 water points located beyond the LGA boundary, as shown in the plot below.

  • 6 Daniel et. al (2020) geoBoundaries: A global database of political administrative boundaries. PlosOne. https://doi.org/10.1371/journal.pone.0231866

  • Show the code
    tmap_mode("view")
    tmap mode set to interactive viewing
    Show the code
    tm_shape(bdy_nga.sf) +
      tm_polygons() +
      tm_view(set.zoom.limits = c(5.5, 12)) +
      
    tm_shape(filter(wp_joined.sf, 
                    is.na(wp_reference))) +
      tm_dots(size = 0.05,
              col = "red")
    Show the code
    tmap_mode("plot")
    tmap mode set to plotting

    3.4.3 Remove Water Point Outside LGA Boundary

    wp_joined1.sf <- wp_joined.sf %>% 
      filter(shapeName == clean_adm2 | shapeName != clean_adm2)

    3.4.4 Combine Unique Value

    questionr::freq(wp_joined1.sf$status_clean)
                                         n    % val%
    Abandoned                          175  0.2  0.2
    Abandoned/Decommissioned           232  0.2  0.3
    Functional                       45874 48.3 54.4
    Functional but needs repair       4579  4.8  5.4
    Functional but not in use         1683  1.8  2.0
    Non-Functional                   29378 30.9 34.8
    Non-Functional due to dry season  2403  2.5  2.8
    Non functional due to dry season     7  0.0  0.0
    NA                               10648 11.2   NA

    Remarks :

    There are 9 unique values for “status_clean”. However, four (4) of them share the same context :

    • “Non functional due to dry season”

    • “Non-Functional due to dry season”

    • “Abandoned”

    • “Abandoned/Decommissioned”

    Hence, the same context values need to combine into one unique value.

    3.4.4.1 combine values with the same context

    wp_joined1.sf$status_clean[wp_joined1.sf$status_clean == "Non functional due to dry season"] <- "Non-Functional due to dry season"
    
    wp_joined1.sf$status_clean[wp_joined1.sf$status_clean == "Abandoned"] <- "Abandoned/Decommissioned"

    -- review combined output

    Show the code
    unique(wp_joined1.sf$status_clean)
    [1] "Non-Functional"                   NA                                
    [3] "Functional"                       "Functional but needs repair"     
    [5] "Abandoned/Decommissioned"         "Functional but not in use"       
    [7] "Non-Functional due to dry season"

    3.4.4.2 compute missing value :: “crucialness_score”

    Show the code
    summary(wp_joined1.sf$water_point_population == 0)
       Mode   FALSE    TRUE    NA's 
    logical   88106    6336     537 
    Show the code
    summary(wp_joined1.sf$local_population_1km == 0)
       Mode   FALSE    TRUE    NA's 
    logical   89985    4457     537 
    Show the code
    summary(wp_joined1.sf$crucialness_score == 0)
       Mode   FALSE    NA's 
    logical   88106    6873 

    Remarks :

    There will be 6,873 water points without crucialness score due to 0 value in 6,336 observations or missing value in 537 observations.

    !!!!! need to remove these 537 observations?

    3.4.4.3 save and read RDS file :: wp_joined1.sf

    Save the updated values into wp_joined1.sf RDS file.

    Show the code
    write_rds(wp_joined1.sf,
              "data/geodata/wp_joined1.sf.rds",
              compress = "xz")
    Show the code
    wp_joined1.sf <- read_rds("data/geodata/wp_joined1.sf.rds")

    3.5 Extract Water Point by Attribute

    3.5.1 Extract Functional Water Point :: wpt_functional.sf

    wpt_functional.sf <- wp_joined1.sf %>%
      filter(status_clean %in%
               c("Functional", 
                 "Functional but not in use",
                 "Functional but needs repair"))

    3.5.1.1 compute data table for clustering analysis

    wp_nga.sf <- bdy_nga.sf %>%
      mutate(`total_wp` = lengths(
        st_intersects(bdy_nga.sf, 
                      wp_joined1.sf))) %>%
      mutate(`wp_functional` = lengths(
        st_intersects(bdy_nga.sf, 
                      wpt_functional.sf))) %>%
      mutate(`pct_functional` = (`wp_functional`/`total_wp`*100))

    3.5.2 Extract Non-Functional Water Point :: wpt_nonFunctional.sf

    wpt_nonFunctional.sf <- wp_joined1.sf %>%
      filter(status_clean %in%
               c("Abandoned/Decommissioned", 
                 "Non-Functional",
                 "Non-Functional due to dry season"))

    3.5.2.1 compute additional variables

    wp_nga.sf <- wp_nga.sf %>%
      mutate(`wp_nonFunctional` = lengths(
        st_intersects(bdy_nga.sf, 
                      wpt_nonFunctional.sf))) %>%
      mutate(`pct_nonFunctional` = (`wp_nonFunctional`/`total_wp`*100))

    3.5.3 Extract Unknown Water Point :: wpt_unknown.sf

    wpt_unknown.sf <- wp_joined1.sf %>%
      filter(status_clean == "Unknown")

    3.5.3.1 compute additional variables

    wp_nga.sf <- wp_nga.sf %>%
      mutate(`wp_unknown` = lengths(
        st_intersects(bdy_nga.sf, 
                      wpt_unknown.sf))) %>%
      mutate(`pct_unknown` = (`wp_unknown`/`total_wp`*100))

    3.5.4 Extract Water Points by “water_tech_category”

    Show the code
    freq(wp_joined1.sf$water_tech_category)

                  var frequency percentage cumulative_perc
    1       Hand Pump     58735      61.84           61.84
    2 Mechanized Pump     25636      26.99           88.83
    3            <NA>     10054      10.59           99.42
    4        Tapstand       553       0.58          100.00
    5 Rope and Bucket         1       0.00          100.00

    Remarks :

    Only “Hand Pump”, “Mechanized Pump”, and “Tapstand” are to be extracted for further analysis as the rest are either less than 0.5% or “Unknown”.

    wpt_hPump.sf <- wp_joined1.sf %>%
      filter(water_tech_category %in% "Hand Pump")
    
    wpt_mPump.sf <- wp_joined1.sf %>%
      filter(water_tech_category %in% "Mechanized Pump")
    
    wpt_tStand.sf <- wp_joined1.sf %>%
      filter(water_tech_category %in% "Tapstand")

    3.5.4.1 compute additional variables

    wp_nga.sf <- wp_nga.sf %>%
      mutate(`total_handPump` = lengths(
        st_intersects(bdy_nga.sf, 
                      wpt_hPump.sf))) %>%
      mutate(`total_mechPump` = lengths(
        st_intersects(bdy_nga.sf,
                      wpt_mPump.sf))) %>%
      mutate(`total_tapStand` = lengths(
        st_intersects(bdy_nga.sf, 
                      wpt_tStand.sf))) %>%
      mutate(`pct_handPump` = (`total_handPump`/`total_wp`*100)) %>%
      mutate(`pct_mechPump` = (`total_mechPump`/`total_wp`*100)) %>%
      mutate(`pct_tapStand` = (`total_tapStand`/`total_wp`*100))

    3.5.5 Extract Water Point by “usage_capacity”

    Show the code
    freq(wp_joined1.sf$usage_capacity)

       var frequency percentage cumulative_perc
    1  300     68768      72.40           72.40
    2 1000     25636      26.99           99.39
    3  250       573       0.60           99.99
    4   50         2       0.00          100.00

    Remarks :

    • Only “300”, “1000”, and “250” are to be extracted for further analysis as the rest are either less than 0.5% or “Unknown”.

    • But, “50” will be included in the new variable “total_ucN1000” as part of the none ‘1000’ “usage_capacity” value.

    • Based on the metadata description, the usage capacity is a recommended value of maximum users per water point based on the Sphere Standards.7

      • 250 people usually consists of tapstand, kiosk, rainwater catchment.

      • 1,000 people - mechanised well.

  • 7 Sphere Association. The Sphere Handbook : Humanitarian Charter and Minimum Standards in Humanitarian Response 2018 Edition. Pg.106. https://spherestandards.org/wp-content/uploads/Sphere-Handbook-2018-EN.pdf

  • wpt_uC300.sf <- wp_joined1.sf %>%
      filter(usage_capacity %in% "300")
    
    wpt_uC1000.sf <- wp_joined1.sf %>%
      filter(usage_capacity %in% "1000")
    
    wpt_uC250.sf <- wp_joined1.sf %>%
      filter(usage_capacity %in% "250")
    
    wpt_uC50.sf <- wp_joined1.sf %>%
      filter(usage_capacity %in% "50")

    3.5.5.1 compute additional variables

    wp_nga.sf <- wp_nga.sf %>%
      mutate(`total_uc300` = lengths(
        st_intersects(bdy_nga.sf, 
                      wpt_uC300.sf))) %>%
      mutate(`total_uc1000` = lengths(
        st_intersects(bdy_nga.sf, 
                      wpt_uC1000.sf))) %>%
      mutate(`total_uc250` = lengths(
        st_intersects(bdy_nga.sf, 
                      wpt_uC250.sf))) %>%
      mutate(`total_uc50` = lengths(
        st_intersects(bdy_nga.sf, 
                      wpt_uC50.sf))) %>%
      mutate(`total_ucN1000` = (
        (lengths(
          st_intersects(bdy_nga.sf, wpt_uC300.sf))) +
          (lengths(
            st_intersects(bdy_nga.sf, wpt_uC250.sf))) +
          (lengths(
            st_intersects(bdy_nga.sf, wpt_uC50.sf))))) %>%
      mutate(`pct_ucN1000` = (`total_ucN1000`/`total_wp`*100)) %>%
      mutate(`pct_uc300` = (`total_uc300`/`total_wp`*100)) %>%
      mutate(`pct_uc1000` = (`total_uc1000`/`total_wp`*100)) %>%
      mutate(`pct_uc250` = (`total_uc250`/`total_wp`*100))

    3.5.6 Extract Water Point by “is_urban”

    Show the code
    questionr::freq(wp_joined1.sf$'is_urban')
              n    % val%
    FALSE 75423 79.4 79.4
    TRUE  19556 20.6 20.6

    Remarks :

    Approximately 79.4% of the water points fall within non-urban community.

    wpt_urban1.sf <- wp_joined1.sf %>%
      filter(is_urban %in% "TRUE")
    
    wpt_urban0.sf <- wp_joined1.sf %>%
      filter(is_urban %in% "FALSE")

    3.5.6.1 compute additional variables

    wp_nga.sf <- wp_nga.sf %>%
      mutate(`total_urban1` = lengths(
        st_intersects(bdy_nga.sf, 
                      wpt_urban1.sf))) %>%
      mutate(`total_urban0` = lengths(
        st_intersects(bdy_nga.sf, 
                      wpt_urban0.sf))) %>%
      mutate(`pct_urban1` = (`total_urban1`/`total_wp`*100)) %>%
      mutate(`pct_urban0` = (`total_urban0`/`total_wp`*100))

    3.5.7 Extract Water Point by “crucialness_score”

    Under section 3.4.4.2, there are 6,873 records without value. Hence, these NAs need to first replace with 0 value.

    3.5.7.1 replace NA with 0

    wp_joined1.sf <- wp_joined1.sf %>%
      mutate(crucialness_score = replace_na(crucialness_score, 0))

    3.5.7.2 examine distribution statistically

    Show the code
    summary(wp_joined1.sf$crucialness_score)
       Min. 1st Qu.  Median    Mean 3rd Qu.    Max. 
    0.00000 0.09669 0.26671 0.38363 0.56474 1.00017 
    Show the code
    summary(wp_joined1.sf$crucialness_score == 1)
       Mode   FALSE    TRUE 
    logical   79968   15011 

    Remarks :

    According to the metadata, the “crucialness_score” indicates the importance of each water point to the surrounding communities. The value is a ratio of users assigned to the water point to the total local population within a 1km radius thereof.

    • For non-functional water points, the “crucialness_score” shows how important the water point would be if it were to be rehabilitated.

    • Having a median value of 0.26671 means 50% of the water points supply approximately 26% of residents within 1 km of the water point.

    • According to Sphere Standards8, the distance from any household to the nearest water point should be less than 500 metres.

    • However, 15,011 water points cover entire communities within 1 km. This is approximately 15.8% of the total water points.

  • 8 Sphere Association. The Sphere Handbook : Humanitarian Charter and Minimum Standards in Humanitarian Response 2018 Edition. Pg.106. https://spherestandards.org/wp-content/uploads/Sphere-Handbook-2018-EN.pdf

  • 3.5.7.3 reveal the distribution “crucialness_score” by “shapeName”

    Show the code
    questionr::freq(wp_joined1.sf$crucialness_score[
      wp_joined1.sf$shapeName == "Kirfi"])
              n    % val%
    0         2  2.3  2.3
    0.077914  1  1.1  1.1
    0.115731  1  1.1  1.1
    0.12009   1  1.1  1.1
    0.129994  1  1.1  1.1
    0.147203  1  1.1  1.1
    0.15509   1  1.1  1.1
    0.157345  1  1.1  1.1
    0.164474  1  1.1  1.1
    0.166955  1  1.1  1.1
    0.167232  1  1.1  1.1
    0.170958  1  1.1  1.1
    0.173628  1  1.1  1.1
    0.193043  1  1.1  1.1
    0.210386  1  1.1  1.1
    0.235887  1  1.1  1.1
    0.251512  1  1.1  1.1
    0.258065  1  1.1  1.1
    0.266712  1  1.1  1.1
    0.286574  1  1.1  1.1
    0.298597  1  1.1  1.1
    0.302252  1  1.1  1.1
    0.303544  1  1.1  1.1
    0.319412  1  1.1  1.1
    0.330536  1  1.1  1.1
    0.337174  1  1.1  1.1
    0.338235  1  1.1  1.1
    0.363727  1  1.1  1.1
    0.433821  1  1.1  1.1
    0.470878  1  1.1  1.1
    0.472674  1  1.1  1.1
    0.472941  1  1.1  1.1
    0.473177  1  1.1  1.1
    0.477725  1  1.1  1.1
    0.480092  1  1.1  1.1
    0.484076  1  1.1  1.1
    0.496662  1  1.1  1.1
    0.49864   1  1.1  1.1
    0.50136   1  1.1  1.1
    0.502825  1  1.1  1.1
    0.504512  1  1.1  1.1
    0.512159  1  1.1  1.1
    0.514331  1  1.1  1.1
    0.519908  1  1.1  1.1
    0.524109  1  1.1  1.1
    0.52478   1  1.1  1.1
    0.525721  1  1.1  1.1
    0.526823  1  1.1  1.1
    0.527059  1  1.1  1.1
    0.528302  1  1.1  1.1
    0.534786  1  1.1  1.1
    0.549686  1  1.1  1.1
    0.565784  1  1.1  1.1
    0.606396  1  1.1  1.1
    0.772727  1  1.1  1.1
    0.800382  1  1.1  1.1
    0.846154  1  1.1  1.1
    0.952727  1  1.1  1.1
    0.986722  1  1.1  1.1
    0.989832  1  1.1  1.1
    1        26 29.9 29.9

    Remarks :

    Cannot use means to compute the “crucialness_score” to represent a “shapeName”. As shown in the output above, ranging from 0 to 1, a mean value can reduce the accuracy of the analysis.

    Hence, the “crucialness_score” will be split into 2 groups. Since its 3rd quartile value is around 0.56, 0.6 will be the lowest bin as shown below -

    • x <= 0.60

    • x > 0.60

    3.5.7.4 extract water point

    wpt_cS04.sf <- wp_joined1.sf %>%
      filter(crucialness_score <= 0.6)
    
    wpt_cS10.sf <- wp_joined1.sf %>%
      filter(crucialness_score > 0.6)

    3.5.7.5 compute additional variable

    wp_nga.sf <- wp_nga.sf %>%
      mutate(`total_cs04` = lengths(
        st_intersects(bdy_nga.sf, 
                      wpt_cS04.sf))) %>%
      mutate(`total_cs10` = lengths(
        st_intersects(bdy_nga.sf, 
                      wpt_cS10.sf))) %>%
      mutate(`pct_cs04` = (`total_cs04`/`total_wp`*100)) %>%
      mutate(`pct_cs10` = (`total_cs10`/`total_wp`*100))

    3.5.8 Extract Water Point by “pressure_score”

    Replace NAs with 0 value before computing a new variable associated with “pressure_score”.

    3.5.8.1 replace NA with 0

    wp_joined1.sf <- wp_joined1.sf %>%
      mutate(pressure_score = replace_na(pressure_score, 0))

    3.5.8.2 examine distribution statistically

    Show the code
    summary(wp_joined1.sf$pressure_score)
       Min. 1st Qu.  Median    Mean 3rd Qu.    Max. 
      0.000   0.270   1.026   2.978   2.850 776.970 
    Show the code
    summary(wp_joined1.sf$pressure_score > 1)
       Mode   FALSE    TRUE 
    logical   46898   48081 

    Remarks :

    Based on the metadata, pressure_score is a ratio of water point users assigned by the recommended maximum usage capacity of the water tech deployed for the water point.

    When the score is greater than 1, that reflects the water point is supplying over its limit.

    • 48,081 water points, approximately 50.6% of the water points are over their usage capacity limit.

    3.5.8.3 extract water point

    wpt_pS09.sf <- wp_joined1.sf %>%
      filter(crucialness_score <= 0.9)
    wpt_pS19.sf <- wp_joined1.sf %>%
      filter(crucialness_score > 0.9 & crucialness_score <= 1.9)
    wpt_pS39.sf <- wp_joined1.sf %>%
      filter(crucialness_score > 1.9 & crucialness_score <= 3.9)
    wpt_pS40.sf <- wp_joined1.sf %>%
      filter(crucialness_score > 3.9)

    3.5.8.4 compute additional variables

    wp_nga.sf <- wp_nga.sf %>%
      mutate(`total_ps09` = lengths(
        st_intersects(bdy_nga.sf, wpt_pS09.sf))) %>%
      mutate(`total_ps19` = lengths(
        st_intersects(bdy_nga.sf, wpt_pS19.sf))) %>%
      mutate(`total_ps39` = lengths(
        st_intersects(bdy_nga.sf, wpt_pS39.sf))) %>%
      mutate(`total_ps40` = lengths(
        st_intersects(bdy_nga.sf, wpt_pS40.sf))) %>%
      mutate(`pct_ps09` = (`total_ps09`/`total_wp`*100)) %>%
      mutate(`pct_ps19` = (`total_ps19`/`total_wp`*100)) %>%
      mutate(`pct_ps39` = (`total_ps39`/`total_wp`*100)) %>%
      mutate(`pct_ps40` = (`total_ps40`/`total_wp`*100))

    3.5.9 Extract Water Point by “status_id”

    Show the code
    questionr::freq(wp_joined1.sf$status_id)
                n    % val%
    No      32210 33.9 33.9
    Unknown 10178 10.7 10.7
    Yes     52591 55.4 55.4

    3.5.9.1 extract water point

    wpt_stat1 <- wp_joined1.sf %>%
      filter(status_id %in% "Yes")
    
    wpt_stat0 <- wp_joined1.sf %>%
      filter(status_id %in% "No")

    3.5.9.2 compute additional variables

    wp_nga.sf <- wp_nga.sf %>%
      mutate(`total_status1` = lengths(
        st_intersects(bdy_nga.sf, 
                      wpt_stat1))) %>%
      mutate(`total_status0` = lengths(
        st_intersects(bdy_nga.sf, 
                      wpt_stat0))) %>%
      mutate(`pct_stat1` = (`total_status1`/`total_wp`*100)) %>%
      mutate(`pct_stat0` = (`total_status0`/`total_wp`*100))

    3.5.10 Save and Read RDS File :: wp_nga

    Show the code
    write_rds(wp_nga.sf,"data/geodata/wp_nga.sf.rds")
    wp_nga <- read_rds("data/geodata/wp_nga.sf.rds")

    3.6 Transform Coordinate System

    The EPSG for wp_nga is 4326, which is WGS 84. To compute the proximity distance matrix for clustering analysis, the coordinate reference system for attribute (wp_nga) and boundary (bdy_nga) data frames needs to transform into EPSG: 26391.

    st_set_crs( ) - sf - to update the coordinate reference system.

    wp_ngaTrans <- st_set_crs(wp_nga, 26391)
    Warning: st_crs<- : replacing crs does not reproject data; use st_transform for
    that
    bdy_ngaTrans <- st_set_crs(bdy_nga.sf, 26391)
    Warning: st_crs<- : replacing crs does not reproject data; use st_transform for
    that

    3.6.1 Review CRS :: wp_ngaTrans

    st_crs( ) - sf - to inspect the coordinate reference system.

    st_crs(wp_ngaTrans)
    Coordinate Reference System:
      User input: EPSG:26391 
      wkt:
    PROJCRS["Minna / Nigeria West Belt",
        BASEGEOGCRS["Minna",
            DATUM["Minna",
                ELLIPSOID["Clarke 1880 (RGS)",6378249.145,293.465,
                    LENGTHUNIT["metre",1]]],
            PRIMEM["Greenwich",0,
                ANGLEUNIT["degree",0.0174532925199433]],
            ID["EPSG",4263]],
        CONVERSION["Nigeria West Belt",
            METHOD["Transverse Mercator",
                ID["EPSG",9807]],
            PARAMETER["Latitude of natural origin",4,
                ANGLEUNIT["degree",0.0174532925199433],
                ID["EPSG",8801]],
            PARAMETER["Longitude of natural origin",4.5,
                ANGLEUNIT["degree",0.0174532925199433],
                ID["EPSG",8802]],
            PARAMETER["Scale factor at natural origin",0.99975,
                SCALEUNIT["unity",1],
                ID["EPSG",8805]],
            PARAMETER["False easting",230738.26,
                LENGTHUNIT["metre",1],
                ID["EPSG",8806]],
            PARAMETER["False northing",0,
                LENGTHUNIT["metre",1],
                ID["EPSG",8807]]],
        CS[Cartesian,2],
            AXIS["(E)",east,
                ORDER[1],
                LENGTHUNIT["metre",1]],
            AXIS["(N)",north,
                ORDER[2],
                LENGTHUNIT["metre",1]],
        USAGE[
            SCOPE["Engineering survey, topographic mapping."],
            AREA["Nigeria - onshore west of 6°30'E, onshore and offshore shelf."],
            BBOX[3.57,2.69,13.9,6.5]],
        ID["EPSG",26391]]

    3.6.2 Review CRS :: bdy_ngaTrans

    st_crs(bdy_ngaTrans)
    Coordinate Reference System:
      User input: EPSG:26391 
      wkt:
    PROJCRS["Minna / Nigeria West Belt",
        BASEGEOGCRS["Minna",
            DATUM["Minna",
                ELLIPSOID["Clarke 1880 (RGS)",6378249.145,293.465,
                    LENGTHUNIT["metre",1]]],
            PRIMEM["Greenwich",0,
                ANGLEUNIT["degree",0.0174532925199433]],
            ID["EPSG",4263]],
        CONVERSION["Nigeria West Belt",
            METHOD["Transverse Mercator",
                ID["EPSG",9807]],
            PARAMETER["Latitude of natural origin",4,
                ANGLEUNIT["degree",0.0174532925199433],
                ID["EPSG",8801]],
            PARAMETER["Longitude of natural origin",4.5,
                ANGLEUNIT["degree",0.0174532925199433],
                ID["EPSG",8802]],
            PARAMETER["Scale factor at natural origin",0.99975,
                SCALEUNIT["unity",1],
                ID["EPSG",8805]],
            PARAMETER["False easting",230738.26,
                LENGTHUNIT["metre",1],
                ID["EPSG",8806]],
            PARAMETER["False northing",0,
                LENGTHUNIT["metre",1],
                ID["EPSG",8807]]],
        CS[Cartesian,2],
            AXIS["(E)",east,
                ORDER[1],
                LENGTHUNIT["metre",1]],
            AXIS["(N)",north,
                ORDER[2],
                LENGTHUNIT["metre",1]],
        USAGE[
            SCOPE["Engineering survey, topographic mapping."],
            AREA["Nigeria - onshore west of 6°30'E, onshore and offshore shelf."],
            BBOX[3.57,2.69,13.9,6.5]],
        ID["EPSG",26391]]

    3.6.3 Save and Read RDS File :: wp_ngaTrans

    Show the code
    write_rds(wp_ngaTrans,"data/geodata/wp_ngaTrans.rds")
    write_rds(bdy_ngaTrans,"data/geodata/bdy_ngaTrans.rds")
    wp_ngaTrans <- read_rds("data/geodata/wp_ngaTrans.rds")
    bdy_ngaTrans <- read_rds("data/geodata/bdy_ngaTrans.rds")

    3.7 Exploratory Data Analysis (EDA)

    3.7.1 Geospatial EDA

    Reference of the code chunk below source from Lin S.Y., 20229.

  • 9 Lin S.Y.(2022). Regionalisation Using Water Point Availability in Nigeria. https://lins-92-isss624.netlify.app/take-home_ex02/take-home_ex02#exploratory-data-analysis

  • shapeName_na <- function(x){
      tm_shape(wp_ngaTrans) +
        tm_fill(col=x,
                style="pretty") +
        tm_borders(alpha=0.5) +
        tm_layout(legend.height = 0.2, 
                  legend.width = 0.2)
    }
    
    eda_wpNA <- map(names(wp_ngaTrans)
                    [c(3,5,7,13:15,21:24,28)], 
                    shapeName_na)
    tmap_arrange(eda_wpNA)

    Remarks :

    The LGA that does not have any water points as shown above to be removed from the data frame.

    3.7.1.1 filter state without water point

    wp_ngaTrim <- wp_ngaTrans %>%
      filter(if_all(
        starts_with("total_wp"),~. > 0))

    3.7.1.2 visualise distribution of water status & non-functional water points

    stat1 <- tm_shape (wp_ngaTrim) +
      tm_fill("pct_stat1",
              style = "jenks",
              n = 6,
              title = "Water Observed (%)") +
      tm_layout(main.title = "Water Point with Water Observed",
                main.title.position = "center",
                main.title.size = 0.9,
                main.title.fontface = "bold",
                legend.height = 0.25, 
                legend.width = 0.25,
                frame = TRUE) +
      tm_borders(alpha = 0.5)
    
    nfunc <- tm_shape (wp_ngaTrim) +
      tm_fill("pct_nonFunctional",
              style = "jenks",
              n = 6,
              title = "Non-Functional (%)") +
      tm_layout(main.title = "Non-Functional Water Point",
                main.title.position = "center",
                main.title.size = 0.9,
                main.title.fontface = "bold",
                legend.height = 0.25, 
                legend.width = 0.25,
                frame = TRUE) +
      tm_borders(alpha = 0.5)
    
    tmap_arrange (stat1, nfunc, ncol = 2, asp = 1)

    3.7.1.3 save and read RDS file

    Show the code
    write_rds(wp_ngaTrim,"data/geodata/wp_ngaTrim.rds")
    wp_ngaTrim <- read_rds("data/geodata/wp_ngaTrim.rds")

    3.7.2 Visualise Distribution of Cluster Variable

    Create a data frame with variables for clustering analysis before visualise the distribution.

    3.7.2.1 create cluster variable data frame

    cluster_vars <- wp_ngaTrim %>%
      st_set_geometry(NULL) %>%
      select("shapeName",
             "total_wp",
             "pct_functional", 
             "pct_nonFunctional",
             "pct_handPump",
             "pct_mechPump",
             "pct_tapStand",
             "pct_uc300",
             "pct_uc1000",
             "pct_ucN1000",
             "pct_uc250",
             "pct_urban1",
             "pct_urban0",
             "pct_cs04",
             "pct_cs10",
             "pct_stat1",
             "pct_stat0",
             "pct_ps09",
             "pct_ps19")

    3.7.2.2 replace row ID with “shapeName”

    row.names(cluster_vars) <- cluster_vars$shapeName
    cluster_vars <- cluster_vars %>%
      select(-shapeName)

    3.7.2.3 examine distribution of Cluster Variables

    st_join( ) - sf - to join sf-class objects based on geometry, namely, wp_sf and bdy_nga.

    Reference of the code chunk below source from Lin S.Y., 202210.

  • 10 Lin S.Y.(2022). Regionalisation Using Water Point Availability in Nigeria. https://lins-92-isss624.netlify.app/take-home_ex02/take-home_ex02#exploratory-data-analysis

  • plot_num(cluster_vars)

    3.7.3 Identify Outliers

    Boxplot shows the minimum, maximum, median, first quartile, third quartile and outliers, if any.

    ggarrange(
      (ggplot(data=cluster_vars, aes(x=`pct_functional`)) + 
         geom_boxplot(color="black", fill="#19ff3fFF")), 
      ((ggplot(data=cluster_vars, aes(x=`pct_nonFunctional`)) +
          geom_boxplot(color="black", fill="#ff1919FF"))),
      ((ggplot(data = cluster_vars, aes(x = `pct_handPump`)) +
          geom_boxplot(color="black", fill="#FFA319FF"))),
      ((ggplot(data = cluster_vars, aes(x = `pct_mechPump`)) +
          geom_boxplot(color="black", fill="#ff8419FF"))),
      ((ggplot(data = cluster_vars, aes(x = `pct_tapStand`)) +
          geom_boxplot(color="black", fill="#ff5619FF"))),
      ((ggplot(data = cluster_vars, aes(x = `pct_urban0`)) +
          geom_boxplot(color="black", fill="#19beffFF"))),
      ((ggplot(data = cluster_vars, aes(x = `pct_uc1000`)) +
          geom_boxplot(color="black", fill="#C16622FF"))),
      ((ggplot(data = cluster_vars, aes(x = `pct_ucN1000`)) +
          geom_boxplot(color="black", fill="#543005FF"))),
       ncol = 2,
      nrow = 4)


    3.7.4 Alternate EDA Approach

    With references to various coursemates’ assignment.

    3.7.4.1 set helper function

    -- set Helper Function 1

    The approach and the code chunk refers from Chua Y.T.11

  • 11 Chua Y.T. (2022). 4 Exploratory Data Analysis - Helper Function 1. https://isss624-amelia.netlify.app/exercises/take-home_ex2/take-home_ex2#exploratory-data-analysis

  • hist_box_plot <- function(varname, title){ 
      
      func1 <- ggplot(data = cluster_vars, 
           aes(x = varname)) + 
      geom_histogram(bins = 30,
                     color = "black", 
                     fill = "steelblue") +
      theme_classic() + 
      xlab(title)
      
      func2 <- ggplot(data = cluster_vars, 
             aes(x = varname)) + 
        geom_boxplot(fill = "steelblue", 
                     color = "black") + 
        theme_classic() +
        xlab("") +
        theme(axis.text.y = element_blank(),
              axis.ticks.y = element_blank())
      
    plot_grid(func1,
              func2,
              align = "v",
              ncol = 1)
    }

    -- set Helper Function 2

    hist_plot <- function(varname, title){
      func3 <- ggplot(data = cluster_vars, 
           aes(x = varname)) + 
      geom_histogram(bins = 30,
                     color = "black", 
                     fill = "steelblue") +
      theme_classic() + 
      xlab(title)
    
      func3
    }

    -- set Helper Function 3

    choropleth_plot <- function(varname, style, title) {
      tm_shape(wp_ngaTrim) +
        tm_fill(varname, 
              n = 5,
              style = style) +
        tm_borders(alpha = 0.5) +
        tm_layout(main.title = title,
                  main.title.size = 0.8,
                  main.title.position = "center",
                  legend.height = 3, 
                  legend.width = 3,
                  legend.title.size = 0.8,
                  legend.text.size = 0.5,
                  frame = TRUE)+ 
        tm_compass(position = c('left','bottom'))
    }

    3.7.4.2 Univariate Distribution Analysis

    -- visualise cluster variable with histogram and boxplot

    hist_box_plot(cluster_vars$pct_nonFunctional, "Non-Functional Water Point")

    hist_box_plot(cluster_vars$pct_stat1, "Water Point with Water Observed")

    hist_box_plot(cluster_vars$pct_cs10, "Crucialness-score Greater than 0.6")

    hist_box_plot(cluster_vars$pct_handPump, "Hand Pump Deployed")

    -- multiple plot histograms

    pct_functional <- hist_plot(cluster_vars$pct_functional, "pct_functional")
    pct_nonfunctional <- hist_plot(cluster_vars$pct_nonFunctional, "pct_nonFunctional")
    pct_handpump <- hist_plot(cluster_vars$pct_handPump, "pct_handPump")
    pct_mechpump <- hist_plot(cluster_vars$pct_mechPump, "pct_mechPump")
    pct_uc1000 <- hist_plot(cluster_vars$pct_uc1000, "pct_uc1000")
    pct_ucN1000 <- hist_plot(cluster_vars$pct_ucN1000, "pct_ucN1000")
    pct_urban0 <- hist_plot(cluster_vars$pct_urban0, "pct_urban0")
    pct_stat1 <- hist_plot(cluster_vars$pct_stat1, "pct_stat1")
    pct_cs10 <-hist_plot(cluster_vars$pct_cs10, "pct_cs10")
    pct_ps19 <-hist_plot(cluster_vars$pct_ps19, "pct_ps19")
    pct_functional + pct_nonfunctional +
      pct_handpump + pct_mechpump +
      pct_uc1000 + pct_ucN1000 +
      pct_urban0 + pct_stat1 +
      pct_cs10 + pct_ps19 +
      plot_layout(ncol = 2)

    -- multiple plot geospatial EDA

    Show the code
    tmap_arrange(choropleth_plot("wp_functional", "quantile", 
                    "Functional Water Point"),
                 choropleth_plot("wp_nonFunctional", "quantile", 
                    "Non-functional Water Point"), 
                 choropleth_plot("pct_functional", "quantile", 
                    "Pct of functional water point"),
                 choropleth_plot("pct_nonFunctional", "quantile", 
                    "Pct of Non-functional water point"),
                 choropleth_plot("pct_handPump", "quantile", 
                    "Pct of Hand Pump Deployed"),
                 choropleth_plot("pct_mechPump", "quantile", 
                    "Pct of Mechanical Pump Deployed"),
                 choropleth_plot("pct_urban0", "quantile", 
                    "Pct of Water Point in Non-Urban Community"),
                 choropleth_plot("pct_cs10", "quantile", 
                    "Pct of Water Points with Crucialness > 0.6"),
                 choropleth_plot("pct_ps19", "quantile", 
                    "Pct of Water Points with Reaching Usage Limit"),
                 ncol = 2,
                 heights = 5,
                 nrow = 5)

    4. CORRELATION ANALYSIS

    4.1 Multivariate Analysis

    4.1.1 Visualise Correlation Matrix

    corrplot.mixed( ) - corrplot - to use mixed methods to visualise a correlation matrix.

    This plot allows to identify the pattern and the relationship in the matrix.

    corrplot.mixed((cor(cluster_vars)),
                   upper = "number",
                   lower = "ellipse",
                   tl.col = "black",
                   diag = "l",
                   tl.pos = "lt")

    Remarks :

    Following are the pairs with strong correlation :

    correlation coefficients variable_1 variable_2
    1.00 pct_uc1000 pct_ucN1000
    1.00 pct_mechPump pct_uc1000
    -1.00 pct_mechPump pct_ucN1000
    -1.00 pct_uc1000 pct_ucN1000
    -1.00 pct_cs04 pct_cs10
    -1.00 pct_urban1 pct_urban0
    -1.00 pct_ps09 pct_ps19
    0.99 pct_tapStand pct_uc250
    0.99 pct_uc300 pct_ucN1000
    -0.99 pct_mechPump pct_uc300
    -0.99 pct_uc300 pct_uc1000
    0.96 pct_functional pct_stat1
    0.96 pct_nonFunctional pct_stat0
    0.95 pct_cs04 pct_ps09
    0.95 pct_cs10 pct_ps19
    -0.95 pct_cs04 pct_ps19
    -0.95 pct_cs10 pct_ps19

    Since only “usage_capacity” and “water_tech_category” are showing multicollinearity, hence the study will be split into 2 models with water point status by -

    1) “non-functional water point”

    2) “functional”

    4.2 Refine Model :: cluster_varsNF

    4.2.1 Remove Variable

    cluster_varsNF <- cluster_vars %>%
      select(-pct_tapStand, -pct_uc300, -pct_uc250, -pct_urban1, -pct_cs04,-pct_stat0, -pct_ps09)
    corrplot.mixed((cor(cluster_varsNF)),
                   upper = "number",
                   lower = "ellipse",
                   tl.col = "black",
                   diag = "l",
                   tl.pos = "lt")

    Remarks :

    “pct_handPump” and “pct_mechPump” are negatively correlated at -0.82.

    Since hand pump is the instructed main water point technology in the scope of work, “pct_mechPump” will be removed from the model.

    cluster_varsNF1 <- cluster_varsNF %>%
      select(-pct_functional, -pct_mechPump, -pct_uc1000, -pct_ucN1000, -pct_ps19)

    4.2.2 Build Regression Model

    model_test <- lm(total_wp ~ pct_nonFunctional +
             pct_handPump +
             pct_urban0 +
             pct_cs10 +
             pct_stat1,
             data = cluster_varsNF1)
    
    summary(model_test)
    
    Call:
    lm(formula = total_wp ~ pct_nonFunctional + pct_handPump + pct_urban0 + 
        pct_cs10 + pct_stat1, data = cluster_varsNF1)
    
    Residuals:
        Min      1Q  Median      3Q     Max 
    -271.52  -51.51  -11.50   31.22  681.72 
    
    Coefficients:
                      Estimate Std. Error t value Pr(>|t|)    
    (Intercept)       199.1869    18.9601  10.506  < 2e-16 ***
    pct_nonFunctional  -1.0952     0.2089  -5.241 2.07e-07 ***
    pct_handPump        1.0160     0.1300   7.814 1.86e-14 ***
    pct_urban0          0.7333     0.1152   6.363 3.42e-10 ***
    pct_cs10           -1.8779     0.1665 -11.275  < 2e-16 ***
    pct_stat1          -1.4837     0.2200  -6.744 3.06e-11 ***
    ---
    Signif. codes:  0 '***' 0.001 '**' 0.01 '*' 0.05 '.' 0.1 ' ' 1
    
    Residual standard error: 89.64 on 755 degrees of freedom
    Multiple R-squared:  0.3289,    Adjusted R-squared:  0.3245 
    F-statistic: 74.02 on 5 and 755 DF,  p-value: < 2.2e-16

    4.2.3 Detect Multicollinearity

    car::vif(model_test)
    pct_nonFunctional      pct_handPump        pct_urban0          pct_cs10 
             1.764617          1.670228          1.245002          1.643799 
            pct_stat1 
             2.447319 

    Remarks :

    Alert

    When encountering the following error :

    ” Error in vif.default(model_test) : there are aliased coefficients in the mode “

    It means two or more predictor variables in the model are perfectly correlated.

    Note

    Variables with VIF threshold values between 5 to 10 may need to be cautious, but VIF greater than 10 can be problematic to the model performance due to serious collinearity problem.12

  • 12 Chouiry G. (2022). What is an Acceptable Value for VIF? (With References). https://quantifyinghealth.com/vif-threshold/

  • “A VIF value of 10 means that the tolerance of the relevant independent variable is 0.10 and that 90% (𝐑𝟐) of the variable is explained by other variables. This is undesirable, as it indicates that the relevant independent variable is unnecessarily included in the model.”13

  • 13 ResearchGate. Multicollinearity issues: is a value less than 10 acceptable for VIF? https://www.researchgate.net/post/Multicollinearity_issues_is_a_value_less_than_10_acceptable_for_VIF

  • When a study involves a large sample size, the VIF threshold value can be set up to 10.

    Based on the VIF report above, all value is below 5. Hence, there is no multicollinearity in the model.

    5. DATA STANDARDISATION

    5.1 Remove Variable

    cluster_varsNF1 <- cluster_varsNF1 %>%
      select(-total_wp)

    5.2 Standardise Data

    As shown in 3.7.3.3, not all variables are not distributed normally. Hence, standardisation will be required before the clustering analysis.

    5.2.1 Standardise :: Min-Max Method

    wp_stdMM <- normalize(cluster_varsNF1)
    describe(wp_stdMM)
    wp_stdMM 
    
     5  Variables      761  Observations
    --------------------------------------------------------------------------------
    pct_nonFunctional 
           n  missing distinct     Info     Mean      Gmd      .05      .10 
         761        0      618        1   0.3654   0.2354  0.03012  0.08333 
         .25      .50      .75      .90      .95 
     0.22111  0.35593  0.50820  0.64444  0.72727 
    
    lowest : 0.000000000 0.004065041 0.009009009 0.009708738 0.012987013
    highest: 0.852941176 0.857142857 0.864864865 0.878787879 1.000000000
    --------------------------------------------------------------------------------
    pct_handPump 
           n  missing distinct     Info     Mean      Gmd      .05      .10 
         761        0      619        1   0.4956   0.3721  0.00000  0.03125 
         .25      .50      .75      .90      .95 
     0.18605  0.52555  0.78571  0.92593  0.96000 
    
    lowest : 0.000000000 0.009009009 0.009523810 0.012987013 0.013333333
    highest: 0.989898990 0.991011236 0.994555354 0.994604317 1.000000000
    --------------------------------------------------------------------------------
    pct_urban0 
           n  missing distinct     Info     Mean      Gmd      .05      .10 
         761        0      447    0.975   0.7395   0.3267   0.0000   0.1818 
         .25      .50      .75      .90      .95 
      0.5922   0.8717   1.0000   1.0000   1.0000 
    
    lowest : 0.000000000 0.008298755 0.009345794 0.010309278 0.013888889
    highest: 0.992957746 0.993730408 0.993975904 0.996138996 1.000000000
    --------------------------------------------------------------------------------
    pct_cs10 
           n  missing distinct     Info     Mean      Gmd      .05      .10 
         761        0      612        1   0.3318   0.2774  0.02462  0.05091 
         .25      .50      .75      .90      .95 
     0.13542  0.27027  0.47059  0.69841  0.82143 
    
    lowest : 0.000000000 0.001798561 0.003184713 0.006944444 0.008064516
    highest: 0.944444444 0.947368421 0.964285714 0.969696970 1.000000000
    --------------------------------------------------------------------------------
    pct_stat1 
           n  missing distinct     Info     Mean      Gmd      .05      .10 
         761        0      623        1   0.5165   0.2642   0.1724   0.2267 
         .25      .50      .75      .90      .95 
      0.3391   0.4828   0.6866   0.8667   0.9206 
    
    lowest : 0.00000000 0.03030303 0.05555556 0.06666667 0.07692308
    highest: 0.98701299 0.99029126 0.99099099 0.99593496 1.00000000
    --------------------------------------------------------------------------------

    5.2.2 Standardise :: Z-score Method

    wp_stdZ <- scale(cluster_varsNF1)
    describe(wp_stdZ)
    wp_stdZ 
    
     5  Variables      761  Observations
    --------------------------------------------------------------------------------
    pct_nonFunctional 
             n    missing   distinct       Info       Mean        Gmd        .05 
           761          0        618          1 -1.201e-18      1.139   -1.62178 
           .10        .25        .50        .75        .90        .95 
      -1.36438   -0.69793   -0.04573    0.69082    1.34989    1.75056 
    
    lowest : -1.767485 -1.747821 -1.723906 -1.720521 -1.704663
    highest:  2.358458  2.378783  2.416136  2.483486  3.069827
    --------------------------------------------------------------------------------
    pct_handPump 
            n   missing  distinct      Info      Mean       Gmd       .05       .10 
          761         0       619         1 3.424e-18     1.151   -1.5333   -1.4366 
          .25       .50       .75       .90       .95 
      -0.9577    0.0927    0.8977    1.3315    1.4369 
    
    lowest : -1.533321 -1.505447 -1.503854 -1.493139 -1.492068
    highest:  1.529392  1.532834  1.543799  1.543951  1.560645
    --------------------------------------------------------------------------------
    pct_urban0 
            n   missing  distinct      Info      Mean       Gmd       .05       .10 
          761         0       447     0.975 6.197e-17     1.038   -2.3488   -1.7713 
          .25       .50       .75       .90       .95 
      -0.4677    0.4200    0.8274    0.8274    0.8274 
    
    lowest : -2.3488119 -2.3224529 -2.3191273 -2.3160670 -2.3046972
    highest:  0.8050784  0.8075325  0.8083123  0.8151828  0.8274464
    --------------------------------------------------------------------------------
    pct_cs10 
             n    missing   distinct       Info       Mean        Gmd        .05 
           761          0        612          1 -9.464e-17      1.108    -1.2273 
           .10        .25        .50        .75        .90        .95 
       -1.1223    -0.7847    -0.2459     0.5543     1.4645     1.9559 
    
    lowest : -1.325627 -1.318442 -1.312904 -1.297885 -1.293410
    highest:  2.447339  2.459020  2.526603  2.548221  2.669279
    --------------------------------------------------------------------------------
    pct_stat1 
            n   missing  distinct      Info      Mean       Gmd       .05       .10 
          761         0       623         1 9.351e-17     1.143   -1.4879   -1.2529 
          .25       .50       .75       .90       .95 
      -0.7672   -0.1457    0.7357    1.5146    1.7480 
    
    lowest : -2.233545 -2.102491 -1.993279 -1.945226 -1.900869
    highest:  2.035083  2.049261  2.052287  2.073668  2.091249
    --------------------------------------------------------------------------------

    Remarks :

    Comparing the reports above, the Min-Max method is the only method that can standardise the value to between 0 and 1.

    5.2.3 Compare Distribution For Standardisation Method

    Visualise to determine which standardisation method provide the better output.

    ggarrange(
      (ggplot(data = cluster_varsNF1, aes(x = `pct_stat1`)) +
        geom_density(color = "black", fill = "#19ff3fFF") + 
        ggtitle("Before Standardisation")),
      (ggplot(data = (as.data.frame(wp_stdMM)), aes(x = `pct_stat1`)) +
          geom_density(color = "black", fill = "#19ff3fFF") +
          ggtitle("Min-Max Stdsn.")),
      (ggplot(data = (as.data.frame(wp_stdZ)), aes(x = `pct_stat1`)) +
         geom_density(color = "black", fill="#19ff3fFF") +
         ggtitle("Z-score Stdsn.")),
       ncol = 3)

    ggarrange(
      (ggplot(data = cluster_varsNF1, aes(x = `pct_nonFunctional`)) +
        geom_density(color = "black", fill = "#ff1919FF") + 
        ggtitle("Before Standardisation")),
      (ggplot(data = (as.data.frame(wp_stdMM)), aes(x = `pct_nonFunctional`)) +
          geom_density(color = "black", fill = "#ff1919FF") +
          ggtitle("Min-Max Stdsn.")),
      (ggplot(data = (as.data.frame(wp_stdZ)), aes(x = `pct_nonFunctional`)) +
         geom_density(color = "black", fill="#ff1919FF") +
         ggtitle("Z-score Stdsn.")),
       ncol = 3)

    ggarrange(
      (ggplot(data = cluster_varsNF1, aes(x = `pct_handPump`)) +
        geom_density(color = "black", fill = "#FFA319FF") + 
        ggtitle("Before Standardisation")),
      (ggplot(data = (as.data.frame(wp_stdMM)), aes(x = `pct_handPump`)) +
          geom_density(color = "black", fill = "#FFA319FF") +
          ggtitle("Min-Max Stdsn.")),
      (ggplot(data = (as.data.frame(wp_stdZ)), aes(x = `pct_handPump`)) +
         geom_density(color = "black", fill="#FFA319FF") +
         ggtitle("Z-score Stdsn.")),
       ncol = 3)

    ggarrange(
      (ggplot(data = cluster_varsNF1, aes(x = `pct_cs10`)) +
        geom_density(color = "black", fill = "#ff5619FF") + 
        ggtitle("Before Standardisation")),
      (ggplot(data = (as.data.frame(wp_stdMM)), aes(x = `pct_cs10`)) +
          geom_density(color = "black", fill = "#ff5619FF") +
          ggtitle("Min-Max Stdsn.")),
      (ggplot(data = (as.data.frame(wp_stdZ)), aes(x = `pct_cs10`)) +
         geom_density(color = "black", fill="#ff5619FF") +
         ggtitle("Z-score Stdsn.")),
       ncol = 3)

    ggarrange(
      (ggplot(data = cluster_varsNF1, aes(x = `pct_urban0`)) +
        geom_density(color = "black", fill = "#19beffFF") + 
        ggtitle("Before Standardisation")),
      (ggplot(data = (as.data.frame(wp_stdMM)), aes(x = `pct_urban0`)) +
          geom_density(color = "black", fill = "#19beffFF") +
          ggtitle("Min-Max Stdsn.")),
      (ggplot(data = (as.data.frame(wp_stdZ)), aes(x = `pct_urban0`)) +
         geom_density(color = "black", fill="#19beffFF") +
         ggtitle("Z-score Stdsn.")),
       ncol = 3)

    6. CLUSTERING ANALYSIS

    6.1 Hierarchical Clustering

    There are four (4) main steps :

    • compute proximity matrix and determine clustering algorithm.
    • compute Hierarchical Clustering.
    • identify optimal number of cluster and merge similar clusters.
    • update the distance matrix.

    6.1.1 Compute Proximity Matrix and Clustering Algorithm

    First determine the clustering algorithm before compute Hierarchical Clustering analysis.

    6.1.1.1 determine Hierarchical Clustering algorithm

    agnes( ) - cluster - to get agglomerative coefficient of 4 clustering structure, namely “average”, “single”, “complete” and “ward”.

    m <- c("average","single","complete","ward")
    
    names(m) <- c("average","single","complete","ward")
    
    ac <- function(x){agnes(wp_stdMM, method = x)$ac}
    
    map_dbl(m, ac)
      average    single  complete      ward 
    0.9077095 0.8277742 0.9414055 0.9892021 

    Remarks :

    • Value 1 indicates the strongest clustering structure.

    • With value of 0.9892, Ward’s method provides the strongest clustering structure. Therefore, Ward’s method will be used in subsequent analysis.

    6.1.1.2 compute proximity matrix

    dist( ) - stats - to compute the proximity distance matrix. Among euclidean, maximum, manhattan, canberra, binary and minkowski, euclidean is used to compute proxmat_euc.

    prox_mat_euc <- dist(wp_stdMM, 
                         method = 'euclidean')

    6.1.2 Compute Hierarchical Clustering

    hclust( ) - stats - to compute cluster with agglomeration method.

    ggdendrogram( ) - ggdendro - to plot dendrogram with tools available in ggplot2.

    hclust_ward <- hclust(prox_mat_euc, 
                          method = 'ward.D')
    ggdendrogram(hclust_ward,
                 rotate = TRUE,
                 cex = 0.1,
                 theme_dendro = FALSE)

    Remarks :

    This is in spite of adjusting the cex = parameter that scales the resolution of the dendogram to 10%.14

  • 14 Chua Y.T. (2022). Take-home Exercise 2 - Regionalisation of Multivariate Water Point Attributes with Non-spatially Constrained and Spatially Constrained Clustering Methods. https://isss624-amelia.netlify.app/exercises/take-home_ex2/take-home_ex2#computing-hierarchical-clustering

  • 6.1.3 Identify Number of Optimal Cluster

    To determine the optimal clusters to retain, the following commons methods are to be tested :

    • Gap statistic

    • Elbow

    • Average Silhouette

    6.1.3.1 compute Gap Statistic method

    clusGap( ) - cluster - to compute the gap statistic.

    set.seed(12345)
    
    gap_stat <- clusGap(wp_stdMM, 
                        FUN = hcut, 
                        nstart = 25, 
                        K.max = 7, 
                        B = 50)
    
    print(gap_stat, method = "firstmax")
    Clustering Gap statistic ["clusGap"] from call:
    clusGap(x = wp_stdMM, FUNcluster = hcut, K.max = 7, B = 50, nstart = 25)
    B=50 simulated reference sets, k = 1..7; spaceH0="scaledPCA"
     --> Number of clusters (method 'firstmax'): 4
             logW   E.logW       gap      SE.sim
    [1,] 5.007896 5.556869 0.5489733 0.007508419
    [2,] 4.832041 5.428820 0.5967789 0.013537767
    [3,] 4.698841 5.360628 0.6617876 0.012344996
    [4,] 4.591572 5.301564 0.7099919 0.012258503
    [5,] 4.552221 5.254345 0.7021242 0.011632129
    [6,] 4.514782 5.213852 0.6990704 0.011133338
    [7,] 4.475110 5.178753 0.7036430 0.010996961

    Remarks :

    The number of clusters recommended by “firstmax” approach of the Gap Statistic method is 4.

    6.1.3.2 visualise gap_stat

    fviz_nbclust( ) - factoextra - to compute and visualise the Optimal Number of clusters.

    set.seed(12345)
    
    fviz_nbclust(wp_stdMM,
                 FUNcluster = hcut,
                 nstart = 25,  
                 method = "gap_stat", 
                 nboot = 50,
                 linecolor = "white")+
      theme_dark() +
      labs(subtitle = "Gap statistic method")

    6.1.3.3 compute and visualise Total Within Sum of Squares (Elbow) method

    fviz_nbclust(wp_stdMM, 
                 kmeans, 
                 method = "wss",
                 linecolor = "white")+
      theme_dark() +
      labs(subtitle = "Elbow method")

    6.1.3.4 compute and visualise Silhouette method

    fviz_nbclust(wp_stdMM, 
                 kmeans, 
                 method = "silhouette",
                 linecolor = "white") +
      theme_dark() +
      labs(subtitle = "Silhouette method")

    Remarks :

    Method Gap stat Elbow Silhouette
    Optimal Value for K 4 3 3

    Both Elbow method, Silhouette method indicated the 3-cluster by Silhouette method will be used for the rest of the study.

    6.1.4 Merge Similar Clusters

    rect.hclust( ) - stats - to draw a dendrogram with a borders around the selected clusters.

    plot(hclust_ward, cex = 0.5)
    rect.hclust(hclust_ward, 
                k = 3, 
                border = 2:5)

    :::

    6.1.5 Visually-Driven Hierarchical Clustering Analysis

    ::: {.callout-warning appearance=“simple” icon=“false”} The data is loaded into a data frame, but it has to be a data matrix to plot the heatmap. Hence, the data frame will need to first transform into a matrix.

    6.1.5.1 transform data frame into matrix

    data.matrix( ) - base - to transform wp_stdMM data frame into a data matrix, and named it as wp_stdMM_mat.

    wp_stdMM_mat <- data.matrix(wp_stdMM)

    6.1.5.2 plot interactive cluster heatmap

    heatmaply( ) - heatmaply - to build an interactive cluster heatmap. The variables are already transformed with Min-Max method to have comparable values. Hence, neither scaling, normalise or percentise is required.

    heatmaply(wp_stdMM_mat,
              Colv = NA,
              dist_method = "euclidean",
              hclust_method = "ward.D",
              seriate = "OLO",
              colors = Blues,
              k_row = 3,
              margins = c(NA,200,60,NA),
              fontsize_row = 1,
              fontsize_col = 8,
              main="Cluster Heatmap of Non-Functional Water Points",
              xlab = "Attribute",
              ylab = "Nigeria LGA",
              dend_hoverinfo = TRUE
              )

    Remarks :

    Following are the interpretation of the heatmap above :

    • Among these clusters, Cluster 1 has the highest percentage of water points that failed to supply to more than 60% of the residents within 1 km therefrom.

    • Most non-functional and non-urban water points are deployed with hand pumps in Cluster 3.

    • As indicated by the percentage of stat1, water was observed at the majority of the water points in Cluster 3.

    6.1.5.3 create 3 clusters model

    cutree( ) - base - to derive a 3-cluster model, and named the output as groups.

    groups <- as.factor(cutree(hclust_ward, k = 3))

    6.1.5.4 append groups to wp_ngaTrim

    nga_clust.sf <- cbind(wp_ngaTrim, as.matrix(groups)) %>%
      rename(`cluster`=`as.matrix.groups.`)

    6.1.5.5 plot choropleth map :: nga_clust.sf

    clusGeo.map <- tm_shape(nga_clust.sf) +
      tm_fill(col = "cluster",
              title = "Cluster") +
      tm_borders(alpha = 0.3) +
      tm_style("cobalt") +
      tm_layout(main.title = "Non-Spatial Hierarchical Clustering",
                main.title.size = 1.1,
                main.title.position = "center",
                legend.height = 0.3,
                legend.width = 0.1, 
                legend.title.size = 1,
                legend.text.size = 1,
                frame = TRUE,
                asp = 0)
    
    clusGeo.map

    Remarks :

    The choropleth map above shows the fragmented clusters by the used of non-spatial clustering algorithm (hierarchical cluster analysis method).

    6.2 Spatially Constrained Clustering :: SKATER Approach

    SKATER function only supports sp objects in SpatialPolygonDataFrame.

    Hence, the wp_ngaTrim has to first transform into SpatialPolygonDataFrame before proceeding further.

    6.2.1 Convert SF to SP Data Frame

    as_Spatial( ) - sf - to convert wp_ngaTrim into nga_sp in a SP data frame.

    nga.sp <- as_Spatial(wp_ngaTrim)

    6.2.2 Compute Neighbour List

    First compute the neighbour list before plot it.

    6.2.2.1 compute neighbour list from polygon list

    poly2nb( ) - spdep - to compute the neighbours list from polygon list.

    nga.nb <- poly2nb(nga.sp, queen = TRUE)
    
    summary(nga.nb)
    Neighbour list object:
    Number of regions: 761 
    Number of nonzero links: 4348 
    Percentage nonzero weights: 0.750793 
    Average number of links: 5.713535 
    Link number distribution:
    
      1   2   3   4   5   6   7   8   9  10  11  12  14 
      4  16  57 122 177 137 121  71  39  11   4   1   1 
    4 least connected regions:
    136 497 513 547 with 1 link
    1 most connected region:
    496 with 14 links

    Remarks :

    There is no LGA without a link.

    6.2.2.2 plot Neighbour List by Centroid Node

    Plot the boundary first before the neighbour list object to avoid any region from being clipped away.

    plot(nga.sp, border = grey(.5))
    plot(nga.nb, coordinates(nga.sp),
         cex.lab = .7,
         col = "blue", 
         add = TRUE)

    6.2.3 Compute Minimum Spanning Tree (MST)

    To find a minimum path connecting all nodes in a graph, a minimum spanning tree with a minimum weight than all other spanning trees is to be used in subsequent steps.

    6.2.3.1 calculate edge costs

    nbcosts( ) - spdep - to compute the cost of each edge which is the distance between nodes.

    edge_cost <- nbcosts(nga.nb, wp_stdMM)

    6.2.3.2 specify spatial weight

    nb2listw( ) - spdep - to specify edge_cost as the spatial weights. Set the “style” to “B” to ensure the cost values are not row-standardised.

    nga.w <- nb2listw(nga.nb,
                      edge_cost,
                      style = "B")
    summary(nga.w)
    Characteristics of weights list object:
    Neighbour list object:
    Number of regions: 761 
    Number of nonzero links: 4348 
    Percentage nonzero weights: 0.750793 
    Average number of links: 5.713535 
    Link number distribution:
    
      1   2   3   4   5   6   7   8   9  10  11  12  14 
      4  16  57 122 177 137 121  71  39  11   4   1   1 
    4 least connected regions:
    136 497 513 547 with 1 link
    1 most connected region:
    496 with 14 links
    
    Weights style: B 
    Weights constants summary:
        n     nn       S0       S1       S2
    B 761 579121 2116.963 2727.142 29001.78

    6.2.3.3 compute MST

    nbcosts( ) - spdep - to compute the minimum spanning tree.

    nga_minSpanT <- mstree(nga.w)

    6.2.3.4 review class and dimension of the computed MST

    class(nga_minSpanT)
    [1] "mst"    "matrix"
    dim(nga_minSpanT)
    [1] 760   3
    head(nga_minSpanT)
         [,1] [,2]      [,3]
    [1,]   56  197 0.2311487
    [2,]  197  306 0.1954847
    [3,]  306  195 0.3444925
    [4,]  197  274 0.3611552
    [5,]  274  302 0.3559411
    [6,]  302  548 0.1901367

    6.2.3.5 plot MST Neighbour List

    plot(nga.sp, border = gray(.5))
    
    plot.mst(nga_minSpanT,
             coordinates(nga.sp), 
             col = "blue", 
             cex.lab = 0.7, 
             cex.circles = 0.005, 
             add = TRUE)

    6.2.4 Compute Spatially Constrained Cluster

    skater( ) - spdep - to compute the spatially constrained cluster.

    note: ncuts = number of clusters - 1

    clust3 <- spdep::skater(edges = nga_minSpanT[,1:2],
                            data = cluster_varsNF1,
                            method = "euclidean",
                            ncuts = 2)
    str(clust3)
    List of 8
     $ groups      : num [1:761] 3 3 1 3 1 1 1 1 3 1 ...
     $ edges.groups:List of 3
      ..$ :List of 3
      .. ..$ node: num [1:402] 324 556 745 5 215 564 13 576 613 262 ...
      .. ..$ edge: num [1:401, 1:3] 496 631 237 36 209 740 636 302 667 363 ...
      .. ..$ ssw : num 21313
      ..$ :List of 3
      .. ..$ node: num [1:237] 479 480 639 651 761 735 760 482 112 649 ...
      .. ..$ edge: num [1:236, 1:3] 635 86 479 448 760 112 148 649 479 406 ...
      .. ..$ ssw : num 9770
      ..$ :List of 3
      .. ..$ node: num [1:122] 102 33 546 201 538 282 325 359 9 214 ...
      .. ..$ edge: num [1:121, 1:3] 538 201 359 9 214 572 539 325 308 282 ...
      .. ..$ ssw : num 5746
     $ not.prune   : NULL
     $ candidates  : int [1:3] 1 2 3
     $ ssto        : num 42921
     $ ssw         : num [1:3] 42921 38492 36829
     $ crit        : num [1:2] 1 Inf
     $ vec.crit    : num [1:761] 1 1 1 1 1 1 1 1 1 1 ...
     - attr(*, "class")= chr "skater"

    6.2.4.1 tabulate cluster assignment

    ccs3 <- clust3$groups
    table(ccs3)
    ccs3
      1   2   3 
    402 237 122 

    6.2.4.2 plot the pruned tree

    plot(nga.sp, border = gray(.5))
    plot(clust3, 
         coordinates(nga.sp), 
         cex.lab = .7,
         groups.colors = c("red","green","blue", "brown"),
         cex.circles = 0.005, 
         add = TRUE)

    6.2.5 Visualise SKATER Clusters in Choropleth Map

    groups_mat <- as.matrix(clust3$groups)
    
    nga_spClust.sf <- cbind(nga_clust.sf, 
                            as.factor(groups_mat)) %>%
      rename(`sp_cluster`=`as.factor.groups_mat.`)

    To compare the output of hierarchical clustering and spatially constrained hierarchical clustering :

    clusGeo_SKAT.map <- tm_shape(nga_spClust.sf) +
      tm_fill(col = "sp_cluster",
              title = "Cluster") +
      tm_borders(alpha = 0.3) +
      tm_style("cobalt") +
      tm_layout(main.title = "Spatially Constrained SKATER Method",
                main.title.size = 1.1,
                main.title.position = "center",
                legend.height = 0.3,
                legend.width = 0.1, 
                legend.title.size = 1,
                legend.text.size = 1,
                frame = TRUE,
                asp = 0)
    
    clusGeo_SKAT.map

    6.3 ClustGeo Method

    This section consists of two (2) parts i.e. spatially and non-spatially Constrained Cluster analysis.

    6.3.1 Non-Spatially Constrained Hierarchical Cluster Analysis

    Dissimilarity matrix must be an object of class dist.

    6.3.1.1 create Class dist Object

    proxmat_ngc <- dist(wp_stdMM, method = 'euclidean')

    6.3.1.2 compute Non-Spatially Constrained Hierarchical Clustering

    hclustgeo( ) - ClustGeo - to perform a typical Ward-like hierarchical clustering.

    nonGeo_clust <- hclustgeo(proxmat_ngc)
    
    plot(nonGeo_clust, 
         cex = 0.5)
    
    rect.hclust(nonGeo_clust, 
                k = 3, 
                border = 1:5)

    6.3.1.3 derive 5-cluster model

    groups_ngc <- as.factor(cutree(nonGeo_clust, 
                                   k = 3))

    6.3.1.4 combine groups_ngc with wp_ngaTrim

    nga_ngeo_clust.sf <- cbind(
      wp_ngaTrim, 
      as.matrix(groups_ngc)) %>%
      rename(`cluster` = `as.matrix.groups_ngc.`)

    6.3.1.5 visualise Non-Spatially Constrained Hierarchical Cluster

    clusGeo_nSp.map <- tm_shape(nga_ngeo_clust.sf) +
      tm_fill(col = "cluster",
              title = "Cluster") +
      tm_borders(alpha = 0.3) +
      tm_style("cobalt") +
      tm_layout(main.title = "Non-Spatially Constrained ClustGeo Method",
                main.title.size = 1.1,
                main.title.position = "center",
                legend.height = 0.3,
                legend.width = 0.1, 
                legend.title.size = 1,
                legend.text.size = 1,
                frame = TRUE,
                asp = 0)
    
    clusGeo_nSp.map

    6.3.2 Spatially Constrained Hierarchical Cluster Analysis

    6.3.2.1 determine Spatial Distance Matrix

    st_distance( ) - sf - to derive the spatial distance matrix before perform spatially constrained hierarchical clustering.

    as.dist( ) - stats - to convert the data frame into matrix.

    dist <- st_distance(wp_ngaTrim, wp_ngaTrim)
    dist_mat <- as.dist(dist)

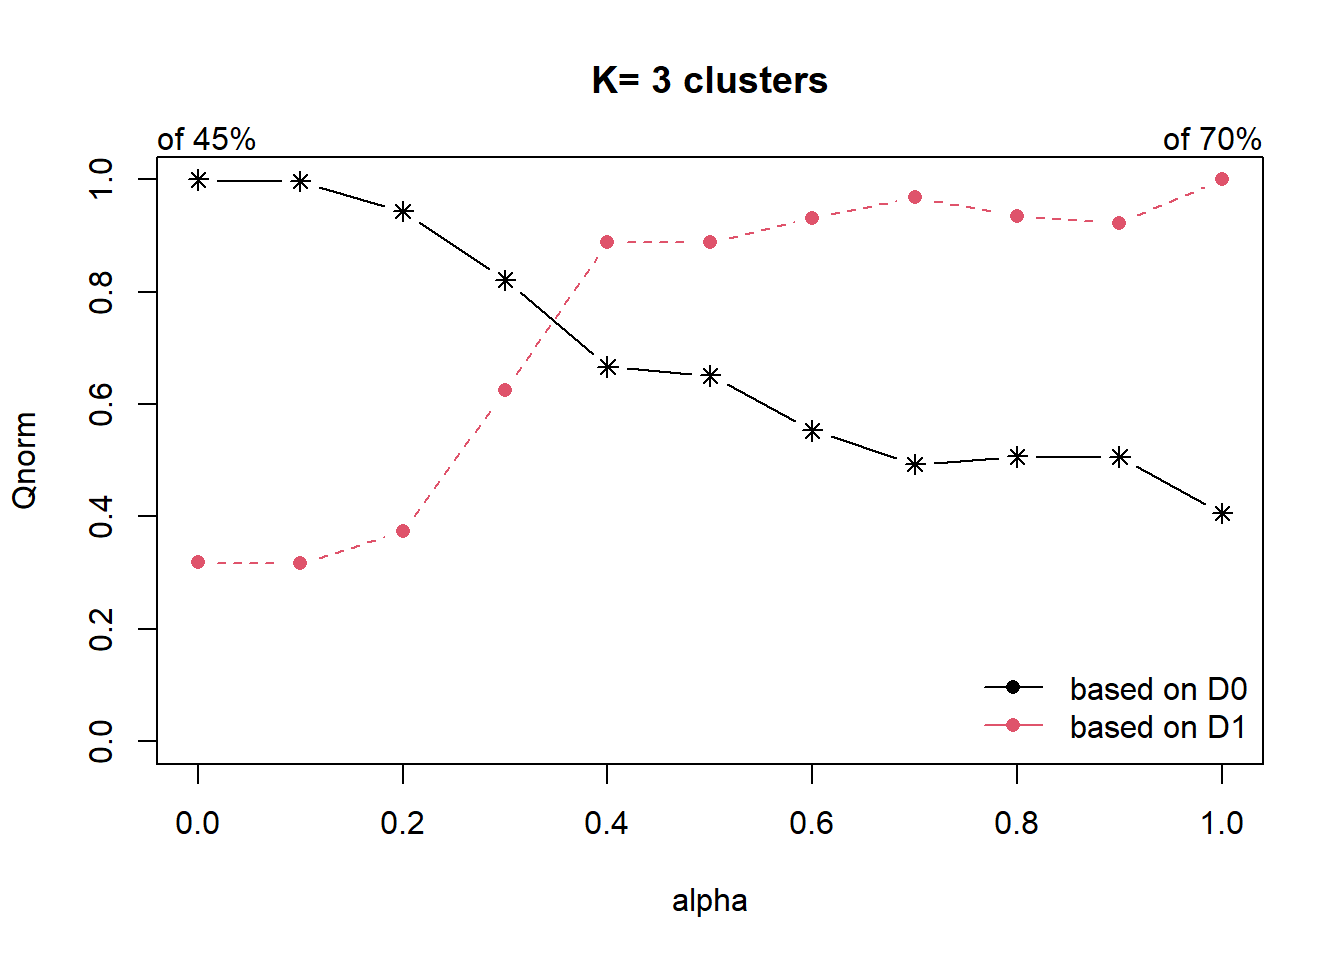
    6.3.2.2 determine Alpha value

    choicealpha( ) - psych - to determine a suitable value for the mixing parameter alpha.

    cr <- choicealpha(
      proxmat_ngc, 
      dist_mat, 
      range.alpha = seq(0, 1, 0.1), 
      K = 3, 
      graph = TRUE)

    Remarks :

    With reference to the plot above, multiple alpha values to be used to perform spatially constrained hierarchical clustering.

    6.3.2.3 compute Spatially Constrained Hierarchical Clustering

    clustG_0.3 <- hclustgeo(proxmat_ngc, 
                        dist_mat, 
                        alpha = 0.3)
    clustG_0.35 <- hclustgeo(proxmat_ngc, 
                        dist_mat, 
                        alpha = 0.35)
    clustG_0.4 <- hclustgeo(proxmat_ngc, 
                        dist_mat, 
                        alpha = 0.4)

    6.3.2.4 derive “cluster” Object

    groups_cg_0.3 <- as.factor(cutree(clustG_0.3, k = 3))
    groups_cg_0.35 <- as.factor(cutree(clustG_0.35, k = 3))
    groups_cg_0.4 <- as.factor(cutree(clustG_0.4, k = 3))

    6.3.2.5 combine groups_cg with wp_ngaTrim

    wp_nga_clustG_0.3 <- cbind(wp_ngaTrim, as.matrix(groups_cg_0.3)) %>%
      rename(`cluster` = `as.matrix.groups_cg_0.3.`)
    wp_nga_clustG_0.35 <- cbind(wp_ngaTrim, as.matrix(groups_cg_0.35)) %>%
      rename(`cluster` = `as.matrix.groups_cg_0.35.`)
    wp_nga_clustG_0.4 <- cbind(wp_ngaTrim, as.matrix(groups_cg_0.4)) %>%
      rename(`cluster` = `as.matrix.groups_cg_0.4.`)

    6.3.2.6 Visualise Spatially Constrained Hierarchical Clustering

    clusGeo_sp.map0.3 <- tm_shape(wp_nga_clustG_0.3) +
      tm_fill(col = "cluster",
              title = "Cluster") +
      tm_borders(alpha = 0.3) +
      tm_style("cobalt") +
      tm_layout(main.title = "Spatially Constrained ClustGeo Method",
                main.title.size = 1.1,
                main.title.position = "center",
                legend.height = 0.3,
                legend.width = 0.1, 
                legend.title.size = 1,
                legend.text.size = 1,
                frame = TRUE,
                asp = 0)
    
    clusGeo_sp.map0.3

    clusGeo_sp.map0.35 <- tm_shape(wp_nga_clustG_0.35) +
      tm_fill(col = "cluster",
              title = "Cluster") +
      tm_borders(alpha = 0.3) +
      tm_style("cobalt") +
      tm_layout(main.title = "Spatially Constrained ClustGeo Method",
                main.title.size = 1.1,
                main.title.position = "center",
                legend.height = 0.3,
                legend.width = 0.1, 
                legend.title.size = 1,
                legend.text.size = 1,
                frame = TRUE,
                asp = 0)
    
    clusGeo_sp.map0.35

    clusGeo_sp.map0.4 <- tm_shape(wp_nga_clustG_0.4) +
      tm_fill(col = "cluster",
              title = "Cluster") +
      tm_borders(alpha = 0.3) +
      tm_style("cobalt") +
      tm_layout(main.title = "Spatially Constrained ClustGeo Method",
                main.title.size = 1.1,
                main.title.position = "center",
                legend.height = 0.3,
                legend.width = 0.1, 
                legend.title.size = 1,
                legend.text.size = 1,
                frame = TRUE,
                asp = 0)
    
    clusGeo_sp.map0.4

    Remarks :

    Three threshold values were tested, i.e. 3 (crossing point in the first alpha value plot), 3.5 (crossing point in the second alpha value plot) and 4 (noticeable elbow in the alpha value plots).

    When the alpha value is set to :

    • 0.3, Cluster 1 scatter around the southwestern region while Cluster 2 has the highest LGA coverage compared to alpha values of 3.5 or 4. Cluster 1 scatter around South-western region.

    • 0.35, Cluster 3 covers more LGA than Cluster 2 with minimal changes to Cluster 1.

    • 0.4, Cluster 1 has the highest LGA coverage compared to alpha values of 3.5 or 4. Cluster 2 expand LGA coverage north-eastward.

    6.4 Spatially Constrained Clustering :: RedCap Method

    6.4.1 Derive Queen Contiguity Spatial Weights

    queen_weights( ) - rgeoda - to create a Queen contiguity weights.

    nga_queenW <- queen_weights(wp_ngaTrim)
    
    nga_queenW
    Reference class object of class "Weight"
    Field "gda_w":
    An object of class "p_GeoDaWeight"
    Slot "pointer":
    <pointer: 0x000001a130ab7e70>
    
    Field "is_symmetric":
    [1] TRUE
    Field "sparsity":
    [1] 0.00750793
    Field "min_neighbors":
    [1] 1
    Field "max_neighbors":
    [1] 14
    Field "num_obs":
    [1] 761
    Field "mean_neighbors":
    [1] 5.713535
    Field "median_neighbors":
    [1] 6
    Field "has_isolates":
    [1] FALSE

    6.4.2 Compute Spatially Constrained Cluster

    redcap( ) - rgeoda - to compute spatially constrained cluster based on three (3) mandatory arguments:-

    • k, the number of clusters to form

    • w, an instance of Weight class

    • df, data frame with cluster variables

    set.seed(12345)
    
    clust_rCap <- redcap(3, 
                         nga_queenW, 
                         wp_stdMM, 
           method = "fullorder-singlelinkage",
           scale_method = 'raw',
           distance_method = "euclidean",
           random_seed = 12345)
    
    str(clust_rCap)
    List of 5
     $ Clusters                                    : int [1:761] 3 3 1 3 1 2 2 1 3 2 ...
     $ Total sum of squares                        : num 3800
     $ Within-cluster sum of squares               : num [1:5] 731 412 692 647 613
     $ Total within-cluster sum of squares         : num 706
     $ The ratio of between to total sum of squares: num 0.186

    6.4.3 Reveal Cluster Assignment

    redCap_cluster <- clust_rCap$Cluster
    
    table(redCap_cluster)
    redCap_cluster
      1   2   3 
    443 219  99 

    6.4.4 Visualise Spatially Constrained Cluster

    redCap_mat <- as.matrix(redCap_cluster)
    
    wp_nga_redCap <- cbind(wp_ngaTrim, as.factor(redCap_mat)) %>%
      rename(`cluster`=`as.factor.redCap_mat.`)
    redCap_sp.map <- tm_shape(wp_nga_redCap) +
      tm_fill(col = "cluster",
              title = "Cluster") +
      tm_borders(alpha = 0.3) +
      tm_style("cobalt") +
      tm_layout(main.title = "Spatially Constrained RedCap Method",
                main.title.size = 1.1,
                main.title.position = "center",
                legend.height = 0.3,
                legend.width = 0.1, 
                legend.title.size = 1,
                legend.text.size = 1,
                frame = TRUE,
                asp = 0)
    
    redCap_sp.map

    7. VISUAL INTERPRETATION

    7.1 Visualise Individual Clustering Variable

    7.1.1 Plot Boxplot

    ggplot(data = nga_ngeo_clust.sf,
           aes(x = cluster, y = pct_nonFunctional)) +
      geom_boxplot()

    Remarks :

    The boxplot reveals Cluster 3 displays the highest mean of non-functional water points. This is followed by Cluster 2.

    7.1.2 Visualise Multivariate

    Create a separate data frame to ensure key variables are included.

    7.1.2.1 prepare data frame

    nga_ngeo_clust.sf1 <- nga_ngeo_clust.sf %>%
      select("shapeName",
             "pct_nonFunctional",
             "pct_handPump", 
             "pct_urban0",
             "pct_cs10",
             "pct_stat1",
             "cluster")
             
    head(nga_ngeo_clust.sf1,3)
    Simple feature collection with 3 features and 7 fields
    Geometry type: MULTIPOLYGON
    Dimension:     XY
    Bounding box:  xmin: 6.778522 ymin: 5.052192 xmax: 7.402708 ymax: 9.232154
    Projected CRS: Minna / Nigeria West Belt
      shapeName pct_nonFunctional pct_handPump pct_urban0 pct_cs10 pct_stat1
    1 Aba North          52.94118    11.764706   0.000000 41.17647  41.17647
    2 Aba South          49.29577     9.859155   5.633803 26.76056  49.29577
    3     Abaji          59.64912    40.350877  84.210526 42.10526  40.35088
      cluster                       geometry
    1       1 MULTIPOLYGON (((7.401109 5....
    2       1 MULTIPOLYGON (((7.334479 5....
    3       2 MULTIPOLYGON (((7.045872 9....

    7.1.2.2 plot parallel coordinate plot

    ggparcoord( ) - GGally - to plot static parallel coordinate plots to reveal distribution of variables by cluster.

    • scale is a character string with the following options -

      • std : univariately, subtract mean & divide by standard deviation.

      • robust : univariately, subtract median & divide by median absolute deviation.

      • uniminmax : univariately, scale the minimum to 0, the maximum to 1.

      • globalminmax : no scaling; the range of the graphs is defined by the global minimum and the global maximum.

      • center : use uniminmax to standardize vertical height, then center each variable at a value specified by the scaleSummary param.

      • centerObs : use uniminmax to standardize vertical height, then center each variable at the value of the observation specified by the centerObsID param

    ggparcoord(data = nga_ngeo_clust.sf1,
               columns = c(2:6),
               mapping = aes(
                 color = as.factor(`cluster`)),
               scale = "uniminmax",
               alphaLines = 0.4,
               boxplot = TRUE,
               groupColumn = "cluster") +
      scale_color_manual("cluster", 
                         values = c("maroon", "steelblue", "darkgreen"),
                         labels = levels(nga_ngeo_clust.sf1$cluster)) +
      labs(title = "Visual Clustering for ClustGeo Method",
           subtitle = "Multiple Parallel Coordinates Plot",
           xlab = "Cluster Variables") +
      facet_grid(~ cluster,) +
      theme(axis.text.x = element_text(angle = 90),
            axis.title.x = element_blank(),
            axis.title.y = element_blank(),
            legend.position = "bottom",
            text = element_text(
              size = 12)) +
      facet_wrap(~ cluster)

    Remarks :

    Based on the parallel coordinate plot above, insights for the stakeholder or decision makers from :

    • the Federal Ministry of Agriculture & Rural Development (FMARD) -

      • Cluster 2 has the highest mean of non-functional water points, followed by Cluster 3, which is slightly higher than Cluster 1.

      • Cluster 3, on the other hand, has the highest mean of non-urban communities and hand pump deployment. It also has the highest mean of non-functional water points with water observed during data collection. That means other causes caused these water points not-functioning accordingly instead of due to the absence of water.

    7.2 Compare Clustering Method Visually

    tmap_arrange(clusGeo.map, clusGeo_SKAT.map, 
                 clusGeo_nSp.map, clusGeo_sp.map0.35,
                 asp = 0,
                 ncol = 2)
    Legend labels were too wide. The labels have been resized to 0.02, 0.02, 0.02. Increase legend.width (argument of tm_layout) to make the legend wider and therefore the labels larger.
    Legend labels were too wide. The labels have been resized to 0.02, 0.02, 0.02. Increase legend.width (argument of tm_layout) to make the legend wider and therefore the labels larger.
    Legend labels were too wide. The labels have been resized to 0.02, 0.02, 0.02. Increase legend.width (argument of tm_layout) to make the legend wider and therefore the labels larger.
    Legend labels were too wide. The labels have been resized to 0.02, 0.02, 0.02. Increase legend.width (argument of tm_layout) to make the legend wider and therefore the labels larger.

    Remarks :

    The output by both Hierarchical Clustering and Hierarchical Clustering by ClustGeo method are relatively similar.

    However, for spatially constrained clustering, ClustGeo method produce a desirable output compare to SKATER and RedCap methods.

    8. CONCLUSION

    8.1 Conclude with Summary Statistics

    nga_ngeo_clust.sf1 %>% 
      st_set_geometry(NULL) %>%
      group_by(cluster) %>%
      summarise(mean_pct_stat1 = mean(pct_stat1),
                mean_pct_nonFunctional = mean(pct_nonFunctional),
                mean_pct_handPump = mean(pct_handPump), 
                mean_pct_cs10 = mean(pct_cs10), 
                mean_pct_urban0 = mean(pct_urban0))
    # A tibble: 3 × 6
      cluster mean_pct_stat1 mean_pct_nonFunctional mean_pct_handP…¹ mean_…² mean_…³
      <chr>            <dbl>                  <dbl>            <dbl>   <dbl>   <dbl>
    1 1                 57.8                   30.5             38.5    14.7    15.7
    2 2                 36.4                   43.4             14.9    54.4    77.9
    3 3                 58.3                   34.5             72.1    26.8    88.7
    # … with abbreviated variable names ¹​mean_pct_handPump, ²​mean_pct_cs10,
    #   ³​mean_pct_urban0

    Remarks :

    • Cluster 2 having the highest mean of non-functional compare to the other two clusters, may require more resources to overhaul water points as 54% of them are currently supplying from 60% up to entire communities within 1 km. These water points may need to :

      • increase the limit of usage capacity.

      • reassign amount of users to the water points.

    • Cluster 3, with average up to 88% of the region falls under non-urban setting, having average 72% of water points deployed with hand pump. However, water was observed in 58% of the non-funcitonal water points. Thus, resources may required to explore further what rendered these water points from being functional.