Functions & Arguments
2 types of bar charts :
geom_bar()geom_bar()usesstat_count()by default: it counts the number of cases at each x position.
geom_col().geom_bar()makes the height of the bar proportional to the number of cases in each group (or if theweightaesthetic is supplied, the sum of the weights)geom_col()for the heights of the bars to represent values in the data, usesstat_identity(): it leaves the data as is.
mapping = NULL,
data = NULL,
stat = “count”,
computed variables can be either “count” or “prop”
position = “stack”,
…,
- Often aesthetics arguments, e.g. colour = “red” or size = 3
just = 0.5,
Adjustment for column placement.
Default = 0.5 = columns to be centered about axis breaks.
Set to 0 or 1 to place columns to the left / right of axis breaks.
width = NULL,
Bar width.
Default = 90% of the resolution( ) of the data.
For discrete variable, the resolution is 1.
na.rm = FALSE,
Default = FALSE = missing values are removed with a warning.
TRUE = missing values are silently removed.
orientation = NA,
show.legend = NA,
Default = NA = includes if any aesthetics are mapped.
FALSE = never includes, and TRUE always includes.
inherit.aes = TRUE
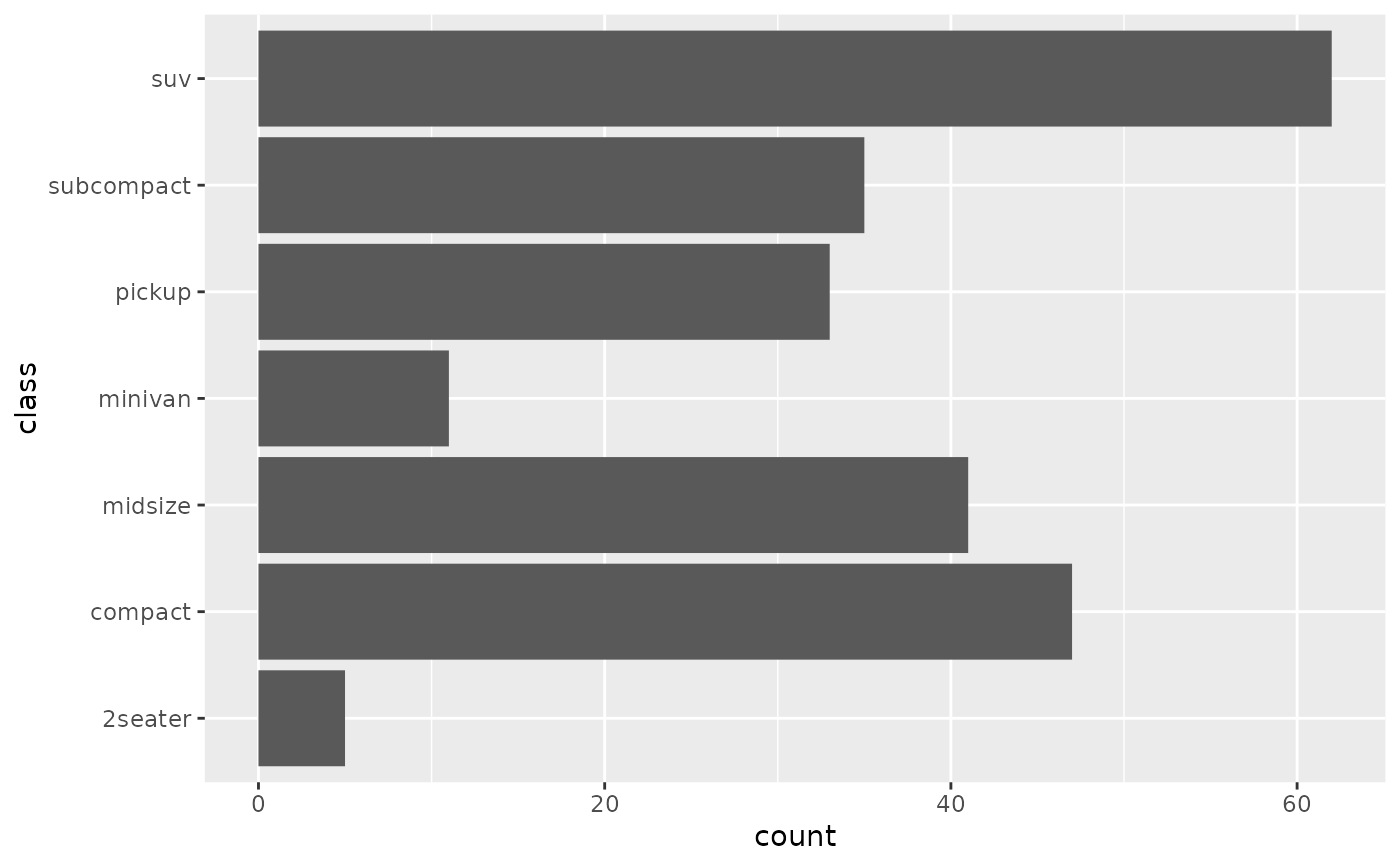
ggplot(mpg) + geom_bar(aes(y = class))
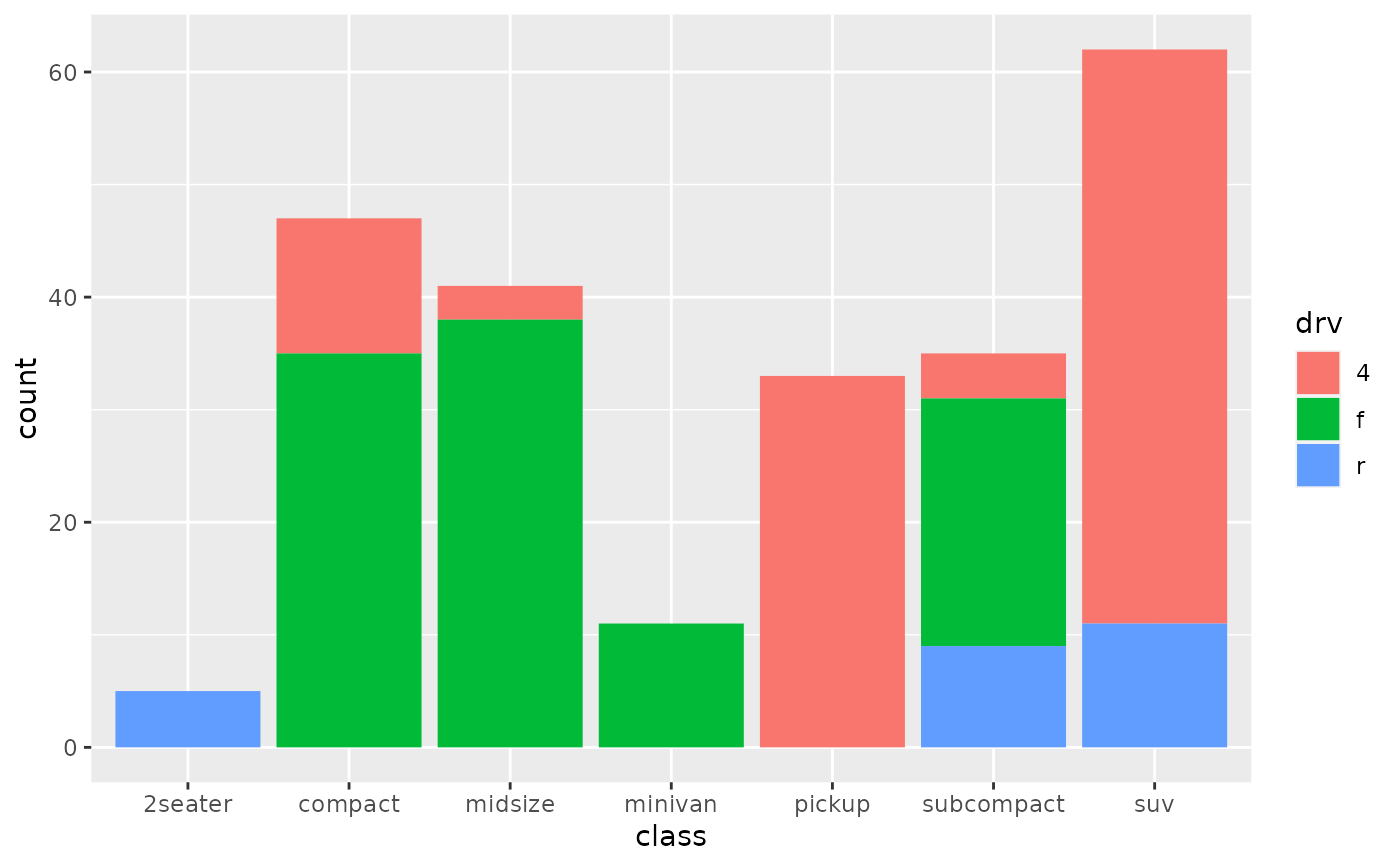
g <- ggplot(mpg, aes(class)) g + geom_bar(aes(fill = drv))
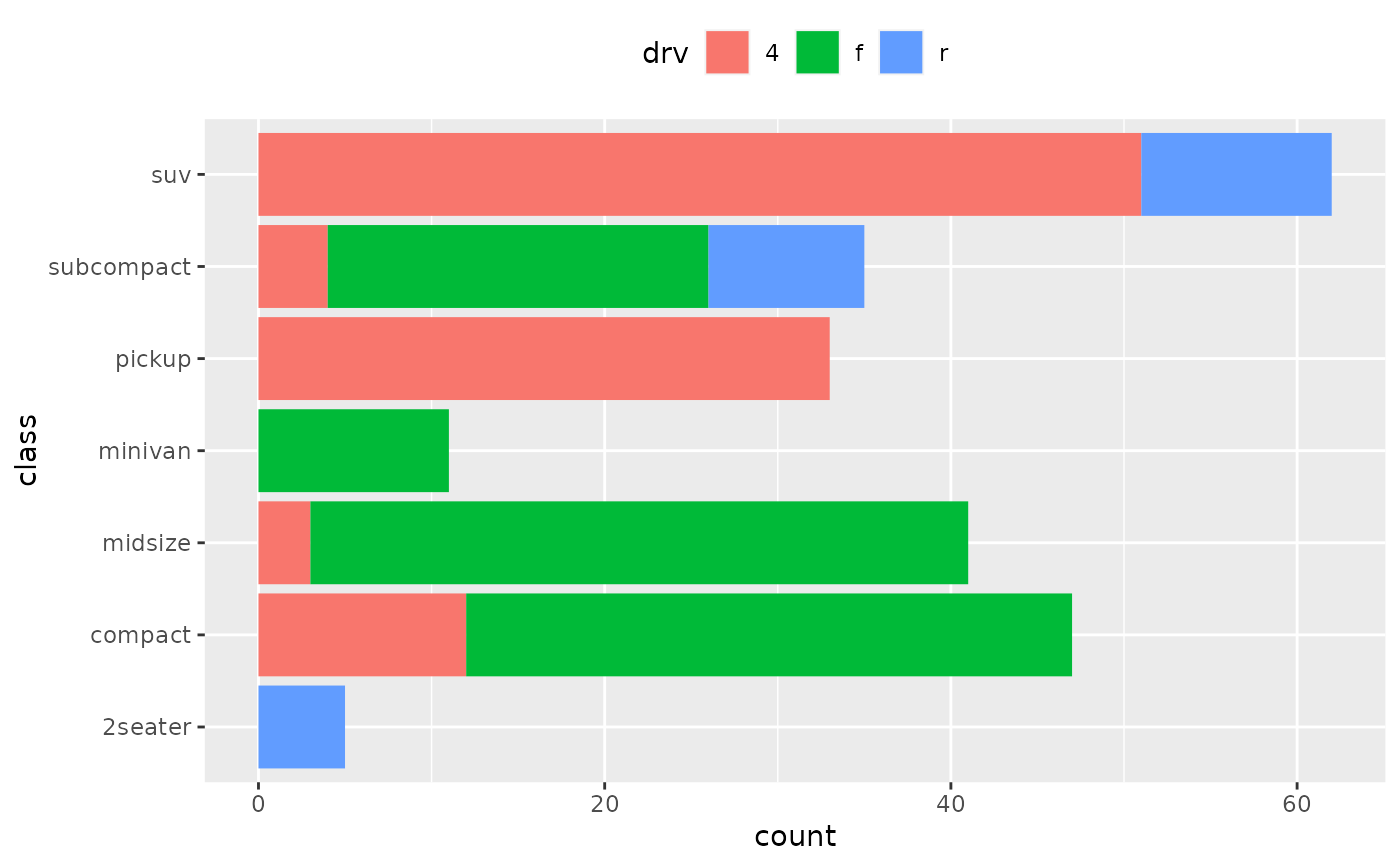
ggplot(mpg, aes( y = class)) + geom_bar(aes( fill = drv), position = position_stack(reverse = TRUE)) + theme(legend.position = “top”)
mapping = NULL,
data = NULL,
position = “stack”,
…,
just = 0.5,
width = NULL,
na.rm = FALSE,
show.legend = NA,
inherit.aes = TRUE
stat_identity(
mapping = NULL,
data = NULL,
geom = “point”,
position = “identity”,
…,
show.legend = NA,
inherit.aes = TRUE
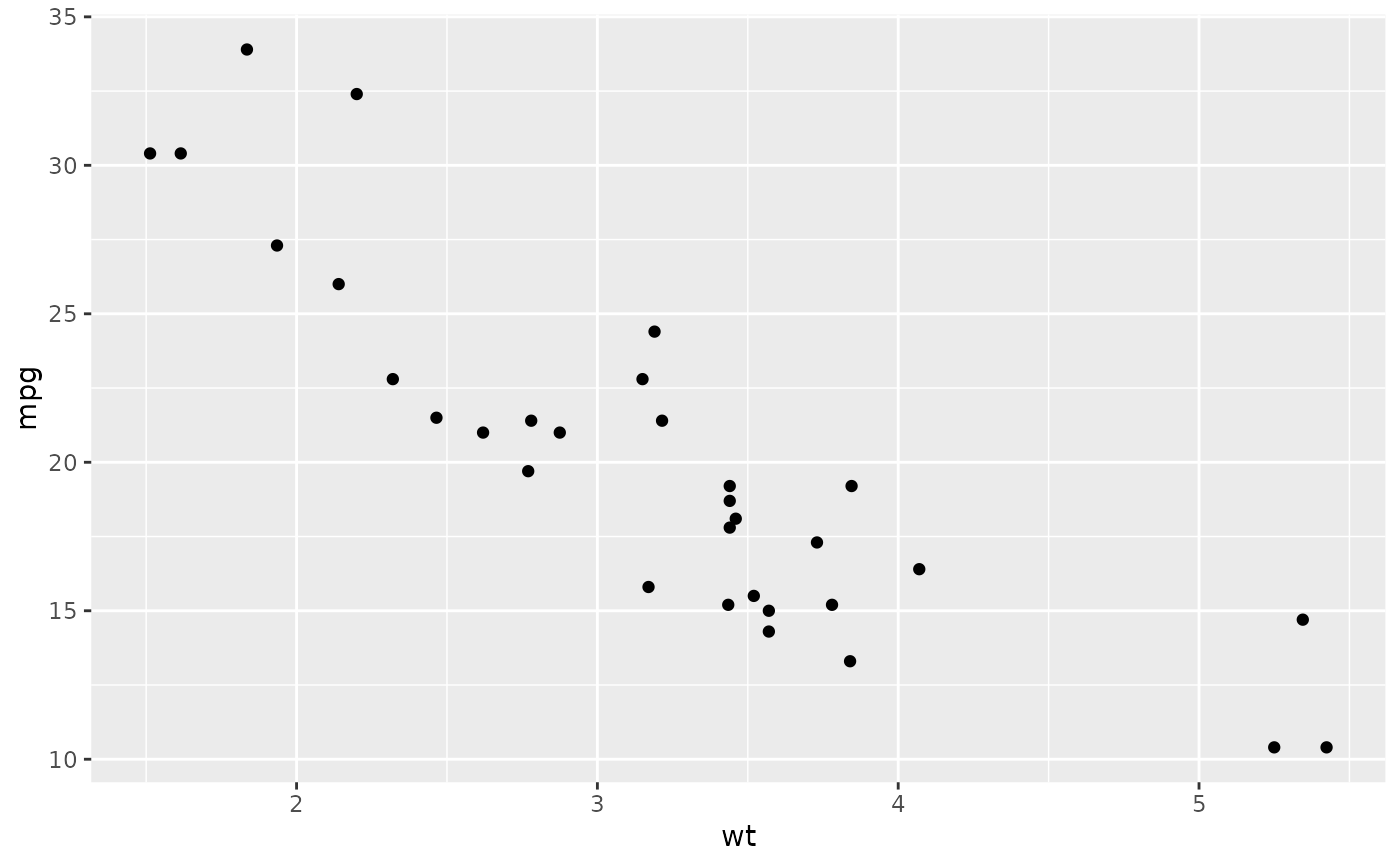
p <- ggplot(mtcars,
aes(wt, mpg))
p + stat_identity( )